|
|
2005 August — Vol. XIV, No. 6 |
|
Current Issues |
|
|
|
|

|
|
|
|
|
|
|
|
|
|
|
|
|
|
EOM August 2005 > Departments > Fire!
Bridging Earth Observations: Remote Sensing Measurements, Fire Modeling, and Air Quality Decision Support System in the Eastern United States
By John J. Qu, Xianjun Hao, Ruixin Yang, William Sommers, Swarvanu Dasgupta, Sanjeeb Bhoi, Menas Kafatos, Yongqiang Liu, Gary Achtemeier, Allen R. Riebau, and Patrick Coronado
Introduction
Prescribed burning is a major tool used by land managers to reduce the threat of catastrophic wildfires and for maintaining forest ecosystem productivity, health, and diversity. However, smoke from fire emissions frequently impacts the air quality of populated areas and is governed by state air quality regulations in most areas. High-resolution models are very useful tools for understanding fire emissions, smoke dispersion, and the air quality effects. The state-of-the-art fire and air quality decision support systems (DSS) such as CAMQ / SMOKE / Bluesky (CSB) provide fire managers and air quality managers with information needed for planning fuels treatments and supporting state air quality smoke regulatory actions, especially as related to prescribed fires.
The primary inputs of the fire modeling and DSS include fuel properties (fuel type, fuel moisture, fuel temperature, and fuel loading) and fire characteristics (burned area, fire location, and active fires). Field measurement of these parameters is costly, provides poor spatial coverage, and lacks sufficient spatial and temporal resolution. Satellite remote sensing should efficiently provide the data needed to significantly improve CSB DSS functioning. To achieve this, we need to demonstrate retrieval of fuel properties and fire characteristics from satellite remote sensing measurements and flexibly integrate these parameters into CSB.
George Mason University (GMU) is a collaborating partner on CSB-RS, a system developed to obtain the necessary fuel and fire data and monitor smoke dispersion using satellite remote sensing (RS) products. The system is being adapted for use in the eastern United States by the USDA Forest Service and cooperators. CSB-RS generates real-time and composite fuel properties and fire characteristics data from NASA / GSFC MODIS Direct Broadcast (DB) measurements and NASA RS data products, such as those from MODIS, MOPITT, TOMS, OMI, and AIRS. CSB DSS performance is enhanced by techniques for efficiently incorporating data from our CSB-RS system. The testing and implementation of the integrated system will be conducted at selected Forest Service sites. This article discusses detailed technical approaches for bridging EOS Remote Sensing Measurements and CSB DSS in the eastern states.
Methodology
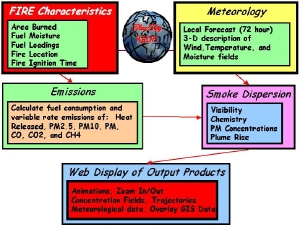
CSB is composed of five components (Figure 1):
- fire characteristics — to provide fuel and fire properties
- emissions — to estimate heat, gases, and particles released from burning
- meteorology — to provide atmospheric fields
- smoke dispersion — to simulate smoke-related atmospheric chemical and physical processes and
- Web display — to provide information to fire and air quality managers and other users.

Figure 1: Components of the BlueSky smoke modeling framework (part of CSB DSS), showing various types of information handled within each component (from USDA/FS BlueSky Web page). Click on image to see enlarged.
Several new unique capabilities based on satellite RS are added to CSB. We develop a prototype application server to process real-time datasets from NASA Direct Readout Portal and composite datasets from NASA DAACs and generate real-time fuel and fire property products automatically. We provide data feeding and validation support to CSB and add an automated check and adjustment of modeled plume trajectories. We feed the resulting RS products for fire and fuel properties and for plume trajectories into CSB and display them with the original CSB products. This allows us to estimate modeling results and to adjust them to improve system performance. Finally, in the eastern states, smoke management concerns differ from those in the western states. Greater relative humidity and more industrial pollution, combined with large numbers of small fires confined to small geographical areas and time periods, result in much different air quality outcomes than in the West. An example of the eastern complexity is burning bans around metropolitan Atlanta during smog season. Incorporating the data products based on NASA missions into CSB will allow better fire emissions inventories, address eastern states fire emissions related to National Ambient Air Quality Standards, and provide CSB with a foundation to address regional haze issues.
EastFIRE CSB-RS Architecture and NASA Data Needs

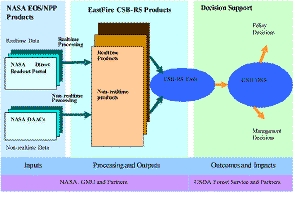
Figure 1: EastFIRE CSB-RS Architecture Click on image to see enlarged.
Figure 2 shows the proposed EastFIRE CSB-RS system architecture. There are three major components: NASA RS inputs (real- time and DAAC's RS data sources); a GMU RS data processing system; and the resulting enhanced CSB DSS system. The following data products derived from NASA RS observations will be valuable: live fuel moisture, fuel type, fuel loading, fuel temperature, area burned, and accurate estimation of active fire locations. We will prototype the GMU RS processing system for operational use. The main steps for RS data processing are:
- Data Collection: We implement two software agents to collect datasets. One is for real-time data collection, which can check satellite overpass time and availability of new datasets, then download near real-time datasets automatically. The other is for high-level data products (MODIS, Landsat, MOPITT and AVHRR) collection from various sensors.
- Data Generation: Once new datasets are available, the system will generate near real-time data products automatically.
- Data Dissemination: Our system will generate datasets according to required BlueSky interface formats. Our system will be integrated to provide near real-time decision support. In addition, we will construct a website for general users to access near real-time fire danger rate, fuel moisture, and fire characteristics. Detailed information and sample images for EastFIRE BSR-RS system can be obtained from the EastFIRE Web page.
Continued below ...
|
|
|
|
|
|
|
|
EastFIRE Real-Time RS Data Processing System

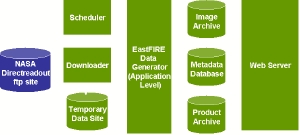
Figure 1: Data flow of the EastFIRE real time RS data processing system. Click on image to see enlarged.
The difficult part of the data processing system is how to handle the real-time data stream. Figure 3 shows the data flow of the proposed EastFIRE Real-Time RS data processing system, which is the main part of the GMU RS data processing system for EastFIRE CSB-RS. The system is being developed with agent-based approaches for easy maintenance, flexible integration and improvements, and future transfer of technologies to interested agencies.
EastFIRE Products of Fuel Property and Fire Characteristics
Our system will generate fuel property and fire characteristics data products using EOS MODIS measurements. The products include: area burned, live fuel moisture, fuel loading, fire location and size, etc.
Burned area is an important fire characteristic and a key input for BlueSky. RS technology can easily and efficiently map burned area. Currently, there are several approaches for remote sensing of burned areas. These algorithms are based on either the vegetation index change or the spectral characteristics of burned area. In real-time applications for rapid response, we will use reflectance to estimate burned area. For accurate estimation of burned area, we can use the algorithms synergistically.
Live fuel moisture is a critical parameter for fire behavior and another key input of BlueSky. Field collection of live fuel moisture data is costly and limited in spatial and temporal resolution. Satellite RS can cost-effectively retrieve live fuel moisture at high spatial and temporal resolution. We can obtain twice daily fuel moisture data using the MODIS instrument onboard the Terra and Aqua satellites, and available algorithms, including some we have recently developed. Currently available techniques for fuel moisture retrieval can be grouped into two categories:
- Empirical methods based on vegetation index and fuel model
- Statistical methods based on the regressive relationship between fuel moisture and remote sensing variables such as NDVI and LST (Land Surface Temperature).
The first approach is based on an algorithm by Burgan et al. (see Further Reading) for live vegetation moisture content estimation. The algorithm is based on current observation and historical records of NDVI, and can be easily implemented for operational use. Currently it is used in Wildland Fire Assessment System (WFAS). We will follow Burgan's approach first but use MODIS EVI instead of NDVI to estimate live fuel moisture. Operational use of statistical approaches is difficult because the needed regressive relationships require field measurements and vary too much by fuel type, geography, and meteorological conditions. However, statistical approaches for retrieving fuel moisture content from RS variables are generally more accurate. We will also use vegetation index and surface temperature to retrieve fuel moisture for comparative analysis and future improvement of live fuel moisture retrieval algorithms.

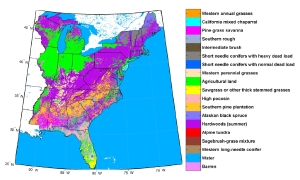
Figure 1: NFDRS fuel model map of the eastern states. (Data source: http://www.fs.fed.us/land/wfas/nfdr_map.htm). Click on image to see enlarged.
Fuel loading varies considerably with fuel type, tree density, species composition, age, etc. Accurate fuel loading information would improve fire emission estimates. Due to a lack of available spatial information on fuel loading, previous estimates of fire emissions have assumed total fuel loading and consumption based on fire experimental data (e.g. 2.5 kilograms per square meter). A preliminary analysis indicates that there is a correlation between Short-Wave Vegetation Index (SWVI) and total forest biomass. The vegetation index can explain 60-66 percent of the variation in post-fire forest re-growth age, an indirect measure of biomass content. For the estimation of the fuel load we will use the National Fire Danger Rating System (NFDRS) fuel model. Figure 4 shows the NFDRS fuel model map of the eastern states (data source from: http://www.fs.fed.us/land/wfas/nfdr_map.htm). The NFDRS fuel model defines parameters like heat content, fuel particle density, total mineral content, effective mineral content, total fuel load, fuel bed depth, surface area to volume ratio, and moisture of extinction for each class. The fuel load for each fuel model class is already computed by extensive field measurement and a lookup table will be used to get the 1 hour, 10 hour, 100 hour, and 1000 hour dead fuel load corresponding to each fuel model class. In order to better represent the current fuel load, we will take the weekly relative greenness map from MODIS NDVI data. The relative greenness will be used to assign corresponding weights while computing the 1 hour, 10 hour, 100 hour, and 1000 hour dead fuel load from the fuel model map. This will reflect the current condition of the fuel load better as compared to taking a constant fuel load value.
Locations of active fires are usually detected with thermal infra-red (TIR) bands because of the higher temperature in fire areas. The Active Fire Detection Product, also called the thermal anomaly product, can be used to detect active fire locations. We will use the rapid response version of MOD14 algorithm to generate active fire product for the eastern states. This product will serve to provide fire locations input to CSB.
2.4 Air Quality Products
The air quality products for the EastFIRE CSB-RS, such as smoke plumes, CO, aerosol index, and visibility, can be used to validate CSB output results.
Smoke plumes: Usually, visible (VIS) bands, especially blue bands, are very sensitive to smoke because of Rayleigh scattering, but shortwave infra-red (SWIR) bands are less sensitive to smoke. Smoke plumes can be detected with satellite RS based on their spectral features in visible bands, SWIR bands and thermal infrared (TIR) bands. We will generate real-time smoke plumes product using MODIS measurements to validate BSR.
Carbon Monoxide: Carbon Monoxide (CO) is one of BSR products. Biomass burning is an important source of global CO concentration which, when influenced by the atmospheric circulation system, can affect areas lying far from the actual source of the fire. We will monitor the regional CO concentration on daily, weekly, and monthly bases for the eastern Unites States. We will get CO data from MOPITT (Measurements of Pollution in the Troposphere) measurements and re-project and re-format the datasets for the eastern states.
Conclusion
We have been collaborating on CSB-RS, a system to obtain necessary fuel and fire properties and monitor smoke dispersion using satellite RS products. We have also established a prototype of real-time RS processing system. The USDA Forest Service and other agencies are migrating the system for use in the East to generate products of fuel properties and fire characteristics based on NASA/GSFC MODIS Direct Broadcast (DB) measurements and NASA RS data products. We use continuous satellite measurements to generate near real time fire-related products, deliver the data products appropriately tuned to specific users, post fire-related information for interested members of the public, and provide support to federal, state, and local decision makers. It is a rich system, with significant potential for future growth. We solicit collaboration with federal, state, and university colleagues to redeem that potential. ![]()
About the Authors
John J. Qu, Xianjun Hao, Ruixin Yang, William Sommers, Swarvanu Dasgupta, Sanjeeb Bhoi, and Menas Kafatos are at the Center for Earth Observing and Space Research (CEOSR), of the School of Computational Sciences at George Mason University, in Fairfax, Virginia. John Qu can be reached at [email protected]. Yongqiang Liu and Gary Achtemeier are at the Southern Research Station of the USDA Forest Service. Allen R. Riebau is in the Research and Development office of the USDA Forest Service in Washington, D.C. Patrick Coronado is at NASA's Goddard Space Flight Center in Maryland.
Further Reading
G. L. Achtemeier, "Predicing dispersion and deposition of ash from burning cane," in Sugar Cane, 1:17-22, 1988.
Barbosa, P. M., Gregoire, J.-M. and Pereira, J.M.C., 1999, An Algorithm for Extracting Burned Areas from Time Series of AVHRR GAC Data Applied at a Continental Scale. Remote Sensing of Environment, 69:253-263.
Burgan, R. E., Hartford, R. A., 1997, Live vegetation moisture calculated from NDVI and used in fire danger rating. 13th Conf. on Fire and For. Met., Lorne, Australia, 27-31.
Burgan, R.E. Klaver RW and Klaver JM, 1998, Fuel models and fire potential from satellite and surface observations. International Journal of Wildland Fire, 8:159-170.
Cahoon D. R., Stocks B. J., Levine J. S., Cofer W. R., and Pierson J. M., 1994, Satellite analysis of the severe 1987 forest fires in northern China and southeastern Siberia. Journal of Geophysical Research, 99:18627-18638.
Chuvieco, E., D. Cocero, D. Riano, P. Martin, J. Martinez-Vega, J. D. L. Riva and F. Perez, 2004, Combining NDVI and surface temperature for the estimation of live fuel moisture content in forest fire danger rating, Remote Sensing of Environment, 92: 322-331.
Chuvieco, E., Deshayes, M., Stach, N., Cocero, D., and Riano, D., 1999, Short-term fire risk: foliage moisture content estimation from satellite data, in "Remote Sensing of Large Wildfires in the European Mediterranean Basin" (Ed. E. Chuvieco). Springer, 17-38.
Dasgupta, S., Qu, J. J., Hao, X., 2005, Design of a Fire Susceptibility Index for fire risk monitoring, EastFire Conference 2005, Fairfax, Virginia, May 11-13, 2005.
Dasgupta, S., Qu, J. J., Hao, X., Bhoi, S., Coronado, P., EastFireWatch : A remote sensing based fire weather monitoring platform for eastern USA, EastFire Conference 2005, Fairfax, Virginia, May 11-13, 2005.
Fernandez, A., Illera, P., and Casanova, J. L., 1997, Automatic mapping of surfaces affected by forest fires in Spain using AVHRR NDVI composite image data. Remote Sensing of Environment, 60:153-162.
Fraser, R., Li Z., 2002, Estimating fire-related parameters in the boreal forest using SPOT VEGETATION. Remote Sensing of Environment, 82: 95-110.
Fraser, H., Li Z., and Cihlar J., 2000, Hotspot and NDVI differencing synergy (HANDS): a new technique for burned area mapping over boreal forest. Remote Sensing of Environment, 74:362-376.
Giglio, L., Descloitresa, J., Justice, C. O., Kaufman Y. J., 2003, An Enhanced Contextual Fire Detection Algorithm for MODIS, Remote Sensing of Environment, 87:273-282.
Hao, X., Qu, J. J., 2005, Real-Time Live Fuel Moisture Retrieval with MODIS Measurements, EastFire Conference 2005, Fairfax, Virginia, May 11-13, 2005.
Hardy, C. C., Burgan, R. E., 1999, Evaluation of NDVI for monitoring live moisture in three vegetation types of western U.S., Photogrammetric Engineering and Remote Sensing 65:603-610.
Kaufman, Y. J., and Justice C. O., 1998, MODIS Fire Products, Algorithm Technical Background Document.
Li, R.-R., Y. J. Kaufman, W. M. Hao, J. M. Salmon, and B. C. Gao, 2004, A Technique for Detecting Burn Scars Using MODIS Data. IEEE Transactions on Geoscience and Remote Sensing, 42:1300-1308.
Li, Z., Khananian, A., Fraser, R., Cihlar, J., 2001, Detecting smoke from boreal forest fires using neural network and threshold approaches applied to AVHRR imagery, IEEE Tran. Geosci. & Rem. Sen., 39:1859-1870.
Li Z., Nadon S., and Cihlar J., 2000, Satellite-based detection of Canadian boreal forest fires: Development and application of algorithm, Int. J. Remote Sens., 21: 3057-3069.
Liu, Y.Q., 2003, Spatial patterns of soil moisture connected to monthly-seasonal precipitation variability in a monsoon region, J. Geophy. Res., 108 (D22), 8856, doi:10.1029/2002JD003124.
Liu, Y.Q, Achtemeier, G. L., Goodrich, S., 2004, Air quality effects of prescribed fires simulated with CMAQ, The third Models-3 Workshop, Chapel Hill, NC, Oct. 18-20, 2004.
Qu, J. J., Hao, X., Yang, R., Dasgupta, S., Bhoi S., Wang, W., Xie, Y., Wang, L., Li, Z., Wolf, H., and Kafatos, M., 2005, A System for Monitoring Fire Characteristics and Fire Danger Potential in the Eastern States Using Remote Sensing Techniques. EastFire Conference 2005, Fairfax, Virginia, May 11-13, 2005.
Wang, W., Hao, X., Qu, J. J., Liu, Y. Q., 2005, A Comprehensive Approach for Detecting Active Fire over the Southeastern United States, EastFire Conference 2005, Fairfax, Virginia, May 11-13, 2005.
Xie, Y., Hao, X., Qu, J. J., Xiong, J., 2005, Smoke Plume Detecting Using MODIS Measurements in Eastern United States, EastFire Conference 2005, Fairfax, Virginia, May 11-13, 2005.
|
|
|
©Copyright 2005-2021 by GITC America, Inc. Articles may not be reproduced, in whole or in part, without prior authorization from GITC America, Inc. |