
|
 |
|
Environmental
Indicators for Coastal Management As human population rises at an accelerated rate, and as a larger percentage of the population lives, works and plays within close proximity of the world’s lakes and coastal regions, some of those ecosystems are showing serious signs of stress. Coral reefs are declining at an alarming rate. High levels of toxic, man-made chemicals are being measured in our lakes. "Dead zones" are found in the mouths of our rivers, where life cannot exist because oxygen has been leeched from the water. In many parts of the world, people protest or litigate against the over-harvesting of certain types of fish and shellfish, whereas commercial fishermen counter that these species play a vital role in supporting their regional economies-not to mention supporting their own families. Our coastal zones represent a vast treasure. Is there a way to exploit them either commercially or recreationally without destroying them? There are clearly regions where society must become better managers of these precious resources, or else risk losing them. If humans are to succeed in striking a balance between ongoing population and economic growth, and the preservation of our planet’s inland and coastal waters, we need tools to monitor changes over time as well as to quantify key cause-and-effect relationships within individual ecosystems. Newly emerging remote sensing technologies provide an excellent tool for scientists to monitor the health of our coastal zones, while also providing commercial industries with a tool to develope viable new ways for harvesting some of their natural resources. In fact, satellites offer the only feasible means to monitor coastal resources on a global scale. Where the Fish are Biting Commercial and sport fisheries are growing more sophisticated. Most fisheries are located in productive coastal regions. Today, many fishermen rely on daily remote sensing measurements of sea surface temperatures to help them decide where to fish. Thermal infrared satellite data show distinct boundary lines on the surface between cold and warm bodies of water. Certain species of fish and shellfish tend to school along such boundaries, where they may be easily harvested.
In the wake of Hurricane Floyd, which brought record flooding to eastern North Carolina, fishermen feared that the massive freshwater runoff would devastate their harvest during the peak fishing season. While the catch in the state’s rivers and estuaries was virtually nil, fishermen caught white shrimp in droves just behind the boundary line where the runoff waters ended and the salty Atlantic waters began. Hordes of shrimp were schooling just on the seaward side of the line, making them easy to catch. Ultimately, that turned out to be a banner year for North Carolina’s shrimp harvest. Remote sensing satellites help fishermen find fish populations based upon clear patterns of temperature and chlorophyll concentrations that are observed at the surface. The Moderate Resolution Imaging Spectroradiometer (MODIS), launched in December 1999 aboard NASA’s Terra satellite, measures sea surface temperature to within a quarter of a degree over cloud-free regions of our planet. MODIS and its companion sensor aboard the OrbView-2 satellite—the Sea-viewing Wide Field-of-view Sensor (SeaWiFS)—can also measure chlorophyll concentration all over the world. Like their land-based cousins, phytoplankton contain the pigment chlorophyll, which gives them their greenish color. All plants use chlorophyll for photosynthesis, the process by which sunlight provides the energy to fuse water molecules and carbon dioxide into carbohydrates. Phytoplankton use carbohydrates as building blocks to grow, and fish and humans consume plants to get these same carbohydrates. If one knows where the food is abundant and the temperature is just right, there’s a good chance it’s the same place that fish are biting. Corals in Crisis Coral reef habitats represent some of the densest and most varied ecosystems on Earth. Although they cover only 0.2 percent of the ocean’s floor, nearly a million species of fish, invertebrates and algae can be found in and around the world’s reefs. While reef habitats appear to be robust, they are extremely fragile. Corals are brittle and usually need warm, relatively nutrient-free waters in order to survive. Over the past 50 years, humans have put an enormous amount of pressure on coral reef environments by altering their waters and tearing up their foundations. From dynamite fishing to pollution to surface temperature warming, many of the world’s reefs are being rapidly sent into oblivion. As much as 27 percent of monitored reef formations have been lost, and as much as 32 percent are at risk of being lost within the next 30 years. Detailed images of the ocean collected by the Landsat 7 ETM+ and other high-resolution remote sensors (i.e., the Advanced Spaceborne Thermal Emission and Reflection Radiometer onboard Terra, and Space Imaging’s IKONOS) have shed some light on this problem. Using data from these sensors, scientists are able to map the world’s coral reefs in a fraction of the time it would take to map them by boat or airplane. Once complete, such a map is not only useful for identifying large-scale threats to reefs, but also allows us to pinpoint those reefs that are in the greatest amount of trouble. As reefs die, their colors dull and they begin to take on a pale, bleached cast. As they become whiter, they reflect more light and thus appear brighter to satellite sensors. This change is usually slow and subtle—too much so to be seen outright in any satellite image. However, scientists are able to identify this change by mapping the variation in the brightness of the individual pixels in a satellite image, and comparing them over a span of months to years. This new and experimental product resembles a three-dimensional relief of the reef, with peaks showing areas with the greatest variation in brightness and flat sections depicting areas with the least variation. Light from the Waves Lake water quality is directly related to water clarity. The water quality of lakes near farms, urban areas, industries or construction sites can sometimes deteriorate because storm water runoff can carry chemicals and sediments from these sites. Such sediments can cloud a lake, and nutrients in the sediments can cause unwanted algae to grow. While degradation is gradual, once a lake becomes polluted (or hypereutrophic) it is sometimes difficult to reverse that damage. In 1865, Italian physicist Pietro Angelo Secchi invented the Secchi disk—an eight-inch-diameter disk painted in an alternating black and white pattern. A person in a boat lowers the disk into a lake and records the depth at which it disappears from sight. This depth, known as the Secchi depth, is a crude but useful measure of water clarity. Although Secchi depths provide an excellent classification system for limnologists, the taking of such measurements is quite labor intensive. While Secchi disk measurements work well for small numbers of lakes, they are not practical for monitoring the more than 30,000 lakes in Michigan, Minnesota and Wisconsin—not to mention all the lakes all over the world. When comparing Secchi disk measurements with Landsat 7 ETM+ data, scientists recently found that remote sensing measurements are just as accurate as those made on the surface. When the amount of blue light reflecting off the lake is high and the red light is low, the lake generally has high water quality. This makes sense—when looking at a clear lake from a distance, it appears blue to our eyes. On the other hand, lakes loaded with algae and sediments reflect less blue light and more red light. Today, lake water quality research has expanded to make use of data from the remote sensors aboard the Terra and IKONOS satellites. Terra provides an efficient means of gathering frequent turbidity measurements of inland water bodies, all over the world, at a resolution of up to 500 meters per pixel. IKONOS allows us to zoom in on smaller lakes at a resolution of up to one meter per pixel. Conclusion Can we exploit our coastal resources for human commerce and recreation without harming them? If we are to succeed in striking such a delicate balance, then satellite remote sensors will clearly play an increasing role. A real challenge that faces the application of remote sensing for coastal issues is the ability to convert the enormous volumes of data currently being collected into information in a form that decision makers can use, and to provide this information to them in a timely fashion. Sadly, probably less than one hundredth of one percent of the population is proficient in extracting knowledge from these data. If we are to unlock and harness the full power of these data, then we must provide tools and training and invite greater numbers of people to explore the Earth system sciences as career options. Via its Earth Observatory, NASA is embarking on an outreach activity that will help build the technological and cognitive bridges the public needs to realize the potential of remote sensing data, and the myriad ways in which these data may be applied for both research and commerce. Better quality and more timely, more comprehensive data are needed by corporate and government managers for them to manage our world’s coastal resources more effectively and efficiently. Using satellite remote sensors, NASA measures a wide suite of geophysical parameters daily over the entire globe, and in an automated fashion produces a range of data products that are available free to the public—or at relatively low cost—in digital form via the Internet. However, more professionals in the government and commercial sectors need training on the tools and techniques for translating these data into knowledge for sound decision-making. Harvesting these data and deriving new scientific knowledge from them will ultimately empower Americans and other people around the world to exploit our world’s coastal resources for nutrition, for their livelihoods and for recreation, all without destroying these resources in the process. About the Authors: David D. Herring is a science writer who has worked for the last 10 years as a contractor at NASA’s Goddard Space Flight Center in Greenbelt, Md. Mr. Herring currently serves as the chief editor of NASA’s Earth Observatory and Visible Earth Web sites. He is also the outreach coordinator for NASA’s Terra mission and currently chairs the NASA Goddard Earth Sciences Directorate’s Education and Outreach Committee. Mr. Herring received B.A. and M.A. degrees from East Carolina University in Greenville, N.C., where he trained in journalism, science education, and science writing. He may be reached via e-mail at [email protected]. John W. Weier is a feature writer and editor for the Earth Observatory Web site at NASA’s Goddard Space Flight Center in Greenbelt, Md. He received his B.A. in physics from Washington University (St. Louis, Mo.) and his M.A. in journalism from New York University. Mr. Weier may be reached via e-mail at [email protected]. Timothy Gubbels is the applications program scientist and leader of the Disaster Management and Natural Hazards Division within the Office of Earth Science at NASA’s headquarters. He may be reached via e-mail at [email protected]. |
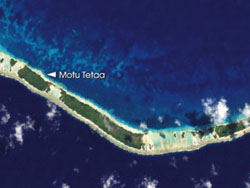 Extreme
temperatures and increased solar irradiation are the main causes of coral
bleaching. During the 1998 bleaching episode in the Rangiroa Atoll, French
Polynesia, a record-breaking El Niño raised the sea surface temperature
almost 1°C higher than the normal highs for that period of the year, and
held it there for three months. Such sustained high temperatures had never
before occurred in the 50 years for which temperatures have been recorded
in the region. This suggests that high temperatures killed the corals
there. (USGS Landsat 7 image courtesy of Serge Andrefouet, University
of South Florida, based on data from the USGS EROS Data Center.)
Extreme
temperatures and increased solar irradiation are the main causes of coral
bleaching. During the 1998 bleaching episode in the Rangiroa Atoll, French
Polynesia, a record-breaking El Niño raised the sea surface temperature
almost 1°C higher than the normal highs for that period of the year, and
held it there for three months. Such sustained high temperatures had never
before occurred in the 50 years for which temperatures have been recorded
in the region. This suggests that high temperatures killed the corals
there. (USGS Landsat 7 image courtesy of Serge Andrefouet, University
of South Florida, based on data from the USGS EROS Data Center.)