
|
 |
|
Meeting
Energy-Sector Needs with NASA Climate Datasets In 2000, energy-sector industries associated with producing, supplying and consuming electrical power exceeded $1.4 trillion. Recent energy-related shortages have fueled the debate over our national energy policy, bringing to the forefront certain issues that concern increased energy-efficient consumption, production of energy from new sources, and the integration of these new sources of power into existing grids. Ensuring affordable energy is critically important to our health of the nation’s economy. As energy-related technologies become more sophisticated, the demand for more detailed weather and solar radiation information increases. Energy-sector industries are incorporating such data into the planning and design of decision-making tools to optimize and integrate the production and use of alternative energy sources with traditional systems. Research from NASA’s Earth Science Enterprise (ESE) is being used to support these decision-making tools directly, to supplement existing surface measurement station networks with additional data information, and to provide data where none is available. The World’s Energy Sector Grows Greener The growth in energy-related industry sectors is rapidly expanding through technological advances. One developing energy source, renewable energy technologies (RETs), is expected to provide between five and 10 percent of the world’s energy within 25 years, rising to 50 percent by 2050. The estimated average growth rate of the solar energy (photovoltaic) market is 25 percent per year through 2010. Growth in wind turbine sales has averaged 40 percent per year for the past five years. Utility-grid-connected solar thermal power plants will be cost competitive with fossil fuel plants in the near future, and various international organizations are currently offering significant economic incentives to deploy initial plants. During the last decade, renewable energy sources contributed substantially to the growth in U.S. energy production, outpacing all fuel sources except for nuclear energy. Estimates of the magnitude and variability of solar energy and prevailing winds are critical to the optimal selection of locations for these technologies. Architects and engineers are incorporating energy-efficient technologies into new building projects. In the U.S. alone, buildings account for 65 percent of electricity use and 36 percent of total energy consumption. U.S. buildings also account for 36 percent of carbon dioxide emissions and 30 percent of greenhouse gas emissions. Dr. Douglas Balcomb, a scientist with the U.S. Department of Energy, has noted that industry now has the capability to design and construct buildings that use 50 percent less energy at no increase in construction cost, if accurate environmental data are available. Raising crops as a fuel source is a large developing industry. This biomass industry originated by using corn crops, but new species are under development. Many other species are also used for biomass-based manufacturing to reduce the reliance on petrochemicals in other industries. The energy industry requires environmental parameters for planning, monitoring and predicting yield of various fuel crops. Finally, with new sources of energy ever increasing, the distribution of this energy is affected by environmental conditions. Utility companies make decisions on buying and selling power based upon information about short-term weather fluctuations and historic seasonal conditions. Traditional weather data for air temperature, precipitation, humidity and wind are no longer sufficient. Optimization within these energy industry sectors is accomplished through decision-making planning and design tools that require detailed meteorological and solar energy information. New information that is needed includes illuminance, ground temperature, wind conditions for various types of vegetation, diffuse skylight, direct-beam solar radiation, and photosynthetically available radiation. With the globalization of energy-sector technologies, particularly in developing countries, such climatological information is required on a global scale. Much of the data used for design projects in these industry sectors consist of networks of surface data. Estimates of parameters for locations between ground sites are obtained by using a variety of interpolation techniques. However, many areas of the globe have no surface networks, and regions that have networks oftentimes contain sporadic data or have inconsistent measurements. As a result, obtaining the comprehensive meteorological and solar energy information for direct use by energy industry decision-making systems on a global basis is a daunting task, and it requires significant resources. The Role of NASA Earth Science Enterprise A major component of NASA’s Earth Science Enterprise is dedicated to understanding the Earth’s energy and hydrological cycles from remote sensing and modeling. This task involves the study of the solar and thermal infrared energy exchanges of the atmosphere with space and with the Earth’s surface. NASA has also established programs in weather data assimilation, surface process modeling, and climate modeling. One of these research programs, the Surface Radiation Budget (SRB) project at NASA’s Langley Research Center, was initiated to produce long-term datasets of the solar and thermal infrared energy exchange at the surface of the Earth. This project is coordinated with the World Climate Research Programme Global Energy and Water Cycle Experiment. The project integrates satellite-based datasets from other NASA projects (e.g., Total Ozone Mapping Spectrometer measurements from the International Satellite Cloud Climatology Project), and a meteorological dataset from the NASA Data Assimilation Office (DAO) at Goddard Space Flight Center. This combination of solar and meteorological datasets gives the opportunity to present these data for industry applications. Such applications began in the middle 1990s in response to a request through the U.S. Department of Energy’s (DOE) National Renewable Energy Laboratory (NREL), for NASA to give data to a private non-profit company to support the feasibility of placing solar cooking devices in African refugee camps. Subsequent discussions with NREL showed that NASA had the potential to provide a unique and much-needed global dataset of solar energy parameters to support the renewable energy industry sector. Thus, the ESE Surface meteorology and Solar Energy (SSE) project was initiated to provide the first global surface solar energy dataset available via the Internet. The dataset provides a globally consistent 1o latitude by 1o longitude (1o x 1o) estimate of meteorological and solar energy parameters used by industries. The Surface Meteorology and Solar Energy Dataset The first version of the SSE dataset, released in 1997, received mixed reviews and little usage. Industry usage was hampered because of the scientific nature of the dataset and its documentation. To address this situation, SSE began to explore methods for marketing the data and working with users. This resulted in formulating partnerships with the NREL and several companies that specialized in the photovoltaic industry, such as Solar Household Energy, Inc., Solar Energy International, Center for Renewable Energy and Sustainable Technology (CREST), and BP Solar International LLC. A partnership with the Canadian government’s Natural Resources Canada (NRCan) Canada Centre for Mineral and Energy Technology Energy Diversification Research Laboratory project resulted in the direct linkage from the renewable energy project design software, RETScreen®, to the solar and meteorological data parameters provided by the SSE Web site. RETScreen® is an analysis tool for preparing feasibility design studies of renewable energy systems. The software represents a decision-making support tool increasingly used within the renewable energy field. Direct linkage to this tool resulted in a five-fold increase in data access and usage of the SSE Web site. Upon increasing the resolution of the dataset to global 1o x 1o, and by adding more meteorological parameters such as surface temperatures and winds, the Web site has grown to having over 5000 registered users in 46 states and 94 countries. Since June 1997, the Web site has generated approximately 900,000 hits, and users have downloaded approximately 150,000 data documents ranging in length from one to 17 pages. Over the past several months, the Web site has averaged 35,000 hits per month from users in non-profit organizations, universities, commercial businesses, financial institutions, and U.S. government agencies. The next version of the SSE Web site will be linked to the SolarSizer software package, a professional software tool for designing and sizing photovoltaic systems. This software represents another industry decision-making tool and is available through the Renewable Energy Policy Project-CREST Web site. Use of the SSE dataset is now spreading outside the renewable energy sector. Diverse applications of the dataset include human health, for identifying dates and regions of illness outbreaks, and agricultural planning, for finding growth regions around the world having climate characteristics similar to U.S. locations. The dataset can be used for many applications of this type and is particularly useful when the industry needs depend on integrating weather and solar energy information. (Figure 1) Continuing Improvements Release 4 of the SSE dataset is a satellite-derived, 10-year climatology of surface solar energy (or insolation), cloud cover, temperature, surface pressure, surface reflectance, relative humidity, and wind parameters available on a 1o x 1o global grid system. This release is scheduled for the summer of 2002, and the dataset will be available free over the Internet. Over 100 monthly averaged, satellite-derived parameters will be available on the Web site for download in plot, text (regional subset data files) or data table formats. Insolation parameters are available for solar cooking, sizing and pointing of solar panels, solar thermal applications, sizing battery storage systems, and sizing surplus-product systems. Geometry and cloud information, temperatures, heating and cooling degree-days, frost days, and wind velocities are also included. (Figure 2) Daily satellite-derived data files are available for surface insolation, top-of-atmosphere insolation, and air temperature. Global and user-defined regional plots can be created for most of the satellite-derived parameters. The additional solar parameters of direct normal and diffuse radiation have been added to this release. Direct normal insolation refers to energy coming directly from the sun’s rays while diffuse radiation refers to solar energy scattered by molecules, clouds, and aerosols. (Figure 3) New 10-meter and 50-meter wind velocity estimates have been added as adapted from the NASA DAO office dataset, including the percentage difference of wind speed at 10 meters from an average wind speed at 50 meters, based on 17 vegetation types. (Figure 4) Also provided are certain statistics for these variables that give information about minimum and maximum anomalies in the monthly averaged parameters from 1983 to 1993. Such statistics give invaluable information about the interannual variability of the parameters and can be incorporated into the design and decision-making process. All form and parameter changes and additions to the Web site have been included based on recommendations by the renewable-energy industry. Finally, daily ground-site data measurements of insolation are provided for approximately 1200 ground-site stations (courtesy of the World Radiation Data Center through the NREL) for comparison to the 1 ox 1o region of interest. SSE Web sites will be updated periodically as the need for new parameters becomes known, or as advanced data become available as part of the long-term NASA ESE science activity. Estimating Parameter Uncertainties Demonstrating that these satellite-based datasets meet the industry’s requirements for accuracy is an ongoing SSE research activity and critical to the datasets’ acceptance and use. To accomplish the uncertainty analysis of the parameters, NASA has obtained datasets of solar energy, temperature, relative humidity, and winds from the NRCan and the NREL. Data from more than 1000 sites around the world are being used for comparisons. Intercomparison of the 1o x 1o area average quantities-to-point measurements is not always conclusive because of microclimates that might surround a particular surface site. For monthly averages, the effect of temporal and spatial mismatches between point measurements and grid-averaged values are reduced. Although bulk aerosol effects on solar energy information have been considered in the present version, local pollution and aerosol events from fires and dust are not accounted for. They can be an additional source of uncertainty in many areas. Therefore,bias difference and total root mean square (RMS) differences are computed between SSE and ground site measurements. Large RMS values with large biases represent systematic errors as the dominant error source, while large RMS with small biases are evidence of more random errors relating to the variability of weather at the site, and related to the 1o x 1o area in which it resides. (Table 1) Considering current industry standards and the typical uncertainties for interpolated ground-site data, NASA found that Release 3 of the SSE dataset is accurate enough for preliminary feasibility studies of renewable energy projects. The forthcoming Release 4 will include improvements to the wind velocities and a wider range of parameters not previously available. Foreshadowing The Future Of SSE: Prediction To date, the energy sector has relied on historical meteorological and solar energy information only to provide location-specific climate context to guide the feasibility and optimization of an energy-producing technology (i.e., wind and solar energy). The historical context helps measure the future performance of the technology at that location. However, information regarding future weather and climate variability is also necessary for accurate design and more efficient system operation. As production increases from such renewable energy sources as wind energy, the problem of integrating electric power from these systems into the electric power grid becomes more acute. Forecasts of diurnal wind and solar energy resources will be required to properly estimate the energy supply. Diurnal estimates of daylighting illuminance are necessary to supplement forecasts of electric power demand that are usually based on temperature. This balance between the supply and demand of affordable energy is vitally important to our economy. The energy industries are continuing to develop decision-support systems to deal with these complexities. This SSE effort envisions the development of datasets to support these decision-making systems directly. (Figure 5) Work is already underway to solidify ties between NASA and other government agencies (such as the National Oceanic and Atmospheric Administration and the Department of Energy), and between NASA and industry (such as the Electric Power Research Institute), to expand the applicability of SSE-type data to prediction requirements. Summary The reliance upon new weather and solar energy data in the production, use and allocation of energy is greatly increasing. Advances in renewable energy technologies, energy-efficient building design systems, energy-producing crops, and energy supply distribution provide the opportunity to optimize designs for specific locations. Such optimization occurs through the development of specific decision support system tools that require detailed meteorological and solar energy information. With the globalization of energy-sector technologies, particularly in developing countries, such climatological information is required on a global scale. Much of the data used for design projects in these industry sectors consist of networks of surface data. In many areas, especially in developing nations, surface measurements are scarce or have short records. Even existing surface networks can contain inconsistent measurements with missing data. Research from NASA’s Earth Science Enterprise can supplement existing surface networks and provide data where none is available. The Surface meteorology and Solar Energy datasets have steadily gained usage as user-community interaction has been vigorously pursued, and as the accuracy of the information has been enhanced. The SSE Web site is now directly linked to two industry decision support tools: RETScreen and SolarSizer. As useful as the historic information is for industrial planning in various fields, its real potential lies in applying techniques and analysis developed here to providing forecasted parameters. As NASA ESE strategy focuses on enabling and improving weather and climate forecasts, we anticipate that providing SSE-like prediction parameters to the energy industry sectors will be extremely important and useful to continuing economic growth and societal improvement. Acknowledgements This work has been funded through the NASA ESE Applications Division and Earth Observing System’s Clouds and the Earth’s Radiant Energy System (EOS/CERES) project. The SSE Web site is maintained at the NASA Langley Atmospheric Sciences Data Center. The Web site and datasets were established and are continually improved through collaborations with Natural Resources Canada, National Renewable Energy Laboratory, BP Solar, Atmospheric Sciences Research Center (State University of New York at Albany), Solar Energy International, Sun Frost Inc., Sunnywood Designs, and Solar Household Energy Inc.u About the Authors: Dr. Paul Stackhouse, Jr., is a research scientist at NASA’s Langley Research Center in Hampton, Va. He earned his Ph.D. in Atmospheric Sciences at Colorado State University. Dr. Stackhouse is currently the lead scientist on two NASA projects: the NASA/World Climate Research Programme Global Energy and Water Cycle Experiment Surface Radiation Budget Project, and the Solar Meteorology and Solar Energy Project. He can be reached via e-mail at [email protected]. Dr. Charles Whitlock is a senior scientist at Science Applications International Corporation in Hampton, Va. Dr. Whitlock holds an M.S. in Aerospace Engineering from the University of Virginia, and a Ph.D. in Civil Engineering from Old Dominion University. He also earned an M.B.A. from the College of William and Mary. He is the former head of the NASA Surface Radiation Budget Project. Dr. Whitlock can be reached via e-mail at [email protected]. Ms. Roberta DiPasquale holds a bachelor’s degree in Meteorology from Pennsylvania State University. She was a marketing specialist and researcher at Science Applications International Corporation while contributing to this project. Mr. Donald E. Brown II is a computer programmer/analyst at Science Applications International Corporation. He holds a bachelors’s degree in the combined major of Physics/Astronomy from the University of Montana. Mr. Brown can be reached via e-mail at [email protected]. Mr. William S. Chandler is a research scientist at Science Applications International Corporation in Hampton, Va. Mr. Chandler earned a bachelor’s degree in Oceanography from Southampton College, Long Island University. He can be reached via e-mail at [email protected]. |
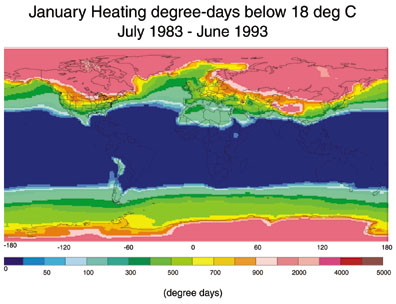 A
global plot of the 10-year average heating degree-days for the month of
January. The heating degree-day is computed relative to 18c degrees.
A
global plot of the 10-year average heating degree-days for the month of
January. The heating degree-day is computed relative to 18c degrees.