| Probabilistic Methods Provide New Tools for Landslide Hazard Mapping
By William C. Haneberg The Problem
The acceptance of rational, or process-based, landslide hazard models as useful tools for watershed assessment, transportation corridor routing, and land-use planning has long been hindered by the inability of simple models to adequately reflect real-world complexity. Any mathematical model is a greatly simplified abstraction of the real world and therefore introduces uncertainty into its results. Model uncertainty is, in turn, compounded by the variability of the parameters in the model. 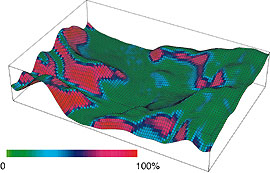 Calculated probability of translational landslide for a 3km x 2km test area southeast of Wheeling, W. Va., draped over a U.S. Geological Survey 30-meter digital elevation model (DEM) of the area. The landslide probability was calculated using a FOSM approach, with soil properties specified by uniform distributions. DEM elevation errors -- which contribute to uncertainties in calculated slope angles and the calculated probability of landslides -- were assumed to be distributed normally, with a variance equal to one-fifth of the RMS elevation error for a DEM. Calculated probability of translational landslide for a 3km x 2km test area southeast of Wheeling, W. Va., draped over a U.S. Geological Survey 30-meter digital elevation model (DEM) of the area. The landslide probability was calculated using a FOSM approach, with soil properties specified by uniform distributions. DEM elevation errors -- which contribute to uncertainties in calculated slope angles and the calculated probability of landslides -- were assumed to be distributed normally, with a variance equal to one-fifth of the RMS elevation error for a DEM.
One common solution - the use of multiple scenarios to account for parameter variability and uncertainty - can produce mountains of results that complicate rather than simplify the decision-making process, all without any assurance of a better outcome. As a result, many land-use managers and planners still rely upon highly subjective and qualitative methods such as aerial photo analysis and geologic map interpretation to assess the landslide potential. Rational probabilistic methods, which combine process-based models with an ability to incorporate parameter variability and uncertainty, can be useful tools in landslide hazard assessment projects. Existing Approaches Fall Short
The traditional approach to landslide hazard mapping has been based upon observation and qualitative inference. An experienced, highly trained geologist first uses a combination of aerial photographs, topographic maps, and geologic maps to produce a landslide inventory map. The geologist then makes inferences about the observed patterns of landslide occurrence and predicts future problem areas based upon geologic or geomorphic similarities. In other words, new landslides are believed likely to occur in areas geologically similar to those where landslides have occurred in the past. Although this traditional method has the advantage of being based upon field observations and, in the best cases, years of professional experience, it is also a highly subjective method with a limited capacity to deal with unprecedented conditions such as major earthquakes, major rainstorms, or profound land-use changes.
Advances in computer technology have opened the doors to a variety of alternative approaches. Some of these approaches are primarily empirical, such as the GIS application SMORPH that was developed by officials in the state of Washington. SMORPH produces maps of high-, medium-, and low landslide-hazard rankings by calculating grids of slope angle and curvature from a digital elevation model (DEM), and then assigning each point on the DEM mesh to a hazard category.
Slope angle and curvature thresholds for hazard rankings can be based upon a strictly empirical comparison of slope angle and curvature values for similar watersheds that are covered by landslide inventory maps, or by quantitative slope stability analyses. Other empirical approaches include Poisson models that predict future landslide frequency based upon past occurrences through time, and regression models based upon such factors as slope, land use, precipitation thresholds, and underlying bedrock types. As with any empirical method that relies solely on past occurrences, empirical probabilistic models have a limited ability to predict slope performance under rare or unprecedented conditions that may not have existed during the period of record.
Another group of methods can be described as rational or process-based because they are built upon the underlying mechanical processes that control slope stability. The GIS packages SHALSTAB, SINMAP and DSLAM, developed by university researchers in California, Utah, Washington, and British Columbia, are applications of rational methods. By far the most common rational approach is the limit-equilibrium method, where a safety-against-sliding factor is calculated as the ratio of resistance to driving forces acting within the slope. Resistance forces typically include soil shear strength, tree root strength and, in engineered slopes, the effects of retaining structures. Driving forces include pore water pressure within the slope, soil weight, and forces arising from seismic shaking.
Spatially distributed applications of rational analyses are generally based upon an infinite slope model, which postulates that the land surface and the landslide slip surface are parallel planes of infinite extent, although recent progress has been made in the development of approaches using curved slip surfaces. This approach is most appropriate in cases where the ratio of landslide thickness to lateral extent is small, and movement occurs primarily by translation rather than through rotation. Some process-based landslide hazard models are linked to steady-state groundwater flow models. These are useful in predicting persistently wet areas in a landscape, but have limited ability to simulate the impact of individual precipitation events.
Perhaps the biggest drawback to using rational models for watershed or similar-scale applications - which can consist of many thousands of cells or grid points - is the difficulty in choosing values to represent highly variable parameters such as soil thickness, shear strength coefficients, and pore water pressure. Even if average values can be determined for individual geologic or soil survey map units, there is bound to be considerable spatial variability within each unit, and pore water pressure will almost certainly vary significantly with time. Additional uncertainties arise when values obtained by testing small samples - on the order of tens of cubic centimeters in the laboratory - are scaled up to represent tens or hundreds of cubic meters in the field, especially because of the inherent artificiality of any laboratory test.
One solution to the nagging problem of parameter variability and uncertainty is the scenario approach, where the modeler repeatedly runs the model to simulate different combinations of parameters. Scenario approaches usually require end-users to comprehend and evaluate the importance of many different scenarios - sometimes a dozen or more - in complicated projects that involve a variety of hydrologic, seismic, or land-use possibilities. This mountain of results can often make the problem seem so overwhelming that quantitative, process-based models are abandoned because they complicate rather than simplify the decision-making process. What Are The Odds?
Rational probabilistic methods provide an alternative to scenario modeling because they are designed to incorporate parameter uncertainty and variability into their input and output. Because uncertainty and variability are put into the model, they are carried through to the results given in terms of landslide probability or slope reliability, all under a certain set of conditions.
Input can be in the form of probability distribution for each parameter across the entire map area, on a unit-by-unit basis or, if sufficient data are available, even on a cell-by-cell basis. The bell-shaped curve of Gaussian (normal) probability distribution is probably the most familiar, but alternatives do exist. These might include uniform, lognormal, triangular, beta, and empirical distributions. Uncertainties in slope angles as calculated from DEMs can also be incorporated if information about elevation uncertainties is available: for example, in the form of the RMS error that is supplied with U.S. Geological Survey DEMs. There is evidence to suggest that DEM elevation errors may be spatially correlated, meaning that the uncertainty associated with calculated slope angles may actually be less than those suggested by RMS elevation errors that do not incorporate the effects of spatial correlation.
Probability distribution of input variables is used in a slope stability calculation, most typically for an infinite slope. The use of a mechanically based model of slope stability is an important difference between rational and empirical probabilistic methods, and allows the rational models to be used to assess the impact of rare or unprecedented conditions that fall outside the bounds of empirical models.
The primary result of a rational probabilistic model is the probability distribution or mean and variance of the dependent variable: in this case, the factor of safety against sliding. Secondary results, based upon the output probability distribution, can include the distribution-dependent probability of sliding (or stability), a distribution-independent reliability index, or the probability that the factor of safety exceeds that which is required for threshold pore water pressure or seismic acceleration. Conditional probability can also be used to incorporate the element of time into a rational probabilistic model: for example, by calculating the probability of landslides - given a particular seismic acceleration - and then calculating the probability of that acceleration that occurs within a specified timeframe.
Rational probabilistic slope stability analyses have historically been performed using numerical simulations based upon Monte Carlo or Latin hypercube algorithms. In these instances input probability distributions are sampled at random, and factors of safety are calculated for each group of input samples. This process is repeated many hundreds of times to produce an ensemble of results that form the probability distribution of the dependent variable: in this case, the factor of safety against sliding.
If all of the input distributions can be specified by using one of the well-known theoretical distributions (normal, uniform, triangular, beta, etc.) then the process can be simplified with confidence by using a first-order, second-moment (FOSM) analytical approach. In a FOSM calculation, a mean value for the safety factor is calculated using the mean values of all of the input variables. The standard deviation is calculated using a first-order truncation of a Taylor series approximation of the variance, or second moment about the mean. FOSM methods are attractive for spatially distributed applications because their non-iterative nature makes them fast and computationally simple. Rather than selecting random deviates for each variable and repeatedly calculating a factor of safety many hundreds of times to obtain an estimate of the mean and variance, a FOSM approach requires only that two equations be evaluated once for each point for which a mean and variance are desired. The savings in time will be controlled by many factors, including the number of iterations necessary to produce reliable results. But in this author's experience, FOSM methods are typically 10 to 100 times faster than are Monte Carlo simulations.
Finally, probabilistic model results require a change in thinking for those accustomed to the "yes or no" outcome of a traditional slope stability analysis, because uncertainty becomes explicit rather than implicit. What probability of sliding should be taken to constitute an unacceptable hazard? The answer is, in large part, a function of the acceptable risk rather than simply the magnitude of the hazard. As a result, there is no simple answer. The potential consequence of landslides must be balanced against the likelihood of a landslide actually occurring. Users can begin to objectively delineate areas of high and low hazard, however, by using image-processing tools such as edge-detection filters to process maps that show the calculated probability of sliding or slope reliability indices. This approach highlights abrupt changes in the calculated probability of sliding or slope reliability, signifying that the values on one side of the abrupt change must be appreciably higher or lower than those on the other side, and can help simplify the interpretation of complicated probabilistic results. About the Author:
William C. Haneberg is an independent consulting geologist based in Port Orchard, Wash. He was previously a senior engineering geologist and assistant director of the New Mexico Bureau of Mines & Mineral Resources, and he taught geology, hydrology, and engineering both at New Mexico Tech and at Portland State University. He may be reached by telephone at: (360) 871-9359, or via e-mail at [email protected]. Back |

