| Multi-criteria Accessibility Evaluation Using GIS as Applied to Industrial Location
By José F.G. Mendes ABSTRACT
Determining the proper spot in which to site an industrial business involves a variety of factors. Some of these elements are closely associated with the accessibility of potential location alternatives, which therefore stress the overall importance of evaluating that accessibility. In this article a multi-criteria accessibility evaluation model is presented. This model stands on the following points. First, the accessibility index is a result of the combination of distances to a set of key destinations relevant to industrial activity. Second, key destinations can have different, weighted priorities. Third, key destinations can be reached either through road or off-road traveling, each factor having a different resistance to movement, otherwise known as friction. Fourth, cost-distances to a key destination are a result of the combination between actual distances and the friction surface. Finally, cost-distances to key destinations can be normalized through fuzzy-set functions that, after weighting, represent their contribution to the accessibility index. This accessibility model was formulated within a GIS context and specified for a particular area of northwestern Portugal. For purposes of this analysis the model is applied to a case study, and an accessibility map of a Portuguese municipality has been developed. 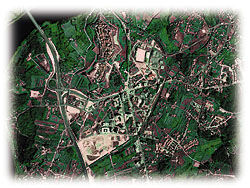 Aerial overview of the Valença urban area. The motorway that links Portugal to Spain crosses the Minho river which is the border between the two countries. Aerial overview of the Valença urban area. The motorway that links Portugal to Spain crosses the Minho river which is the border between the two countries.
Introduction
In a context where land-use is often highly restricted-due primarily to planning and zoning options that impose difficult regulations and limitations-decision-making factors for industrial location should be as rigorous as possible. In other words, both decision rules and criteria must be chosen in such a way that both the aim and the conditions for that decision are accurately described.
In industrial location, a criterion (also called a factor) is some basis for a decision that can be measured and evaluated according to how much that decision enhances or detracts from the suitability of a specific location alternative for the industrial activity. Many authors who have studied the phenomenon of industrial location present lists of factors that are related to particular geographical and socio-economic realities.
Some of the most often-cited industrial factors include cost of transportation and proximity of materials, availability and cost of labor, proximity of markets, presence of industrial clusters, availability and cost of land and buildings, access to infrastructures, facilities and services, personal entrepreneurial preferences, physical conditions of sites, and industrial support policies and subsidies. It is self-evident that some of these factors are closely associated with the accessibility of potential location alternatives, which stresses the importance of evaluating accessibility. Multi-criteria Accessibility Evaluation
The concept and evaluation of accessibility has been a topic of discussion for nearly 200 years. Accessibility depends not only on the location of opportunities, but also on the ability to overcome spatial separation between individuals and specific places.
The model proposed in this article stands on a measure of separation incorporating the effect of distance. The principal theoretical points and assumptions in this model regarding envisioning accessibility include as follows:
a) In this evaluation we are concerned with accessibility for the purpose of industrial location
b) The accessibility index is a result of the combination of dis tances to a set of key destinations, which can be particular points (e.g. facilities), lines (e.g. roads), or areas (e.g. industrial clusters)
c) Key destinations are related to objectives and purpose and can have different priorities (weights)
d) Key destinations can be reached through road or off-road traveling, each method having a different resistance to movement (friction)
e) Cost-distances to a key destination are the result of the combination of an actual distance with the friction surface
f) Off-road friction is a function of the slope
g) Cost-distances to key destinations can be normalized through fuzzy-set functions that, after weighting, represent their contribution to the accessibility index.
Denoting the fuzzy-set membership function applied to cost-distances by f(cij), and the weight of key destination j by wj, the accessibility of a location.
Point/s i, for which accessibility is measured, depend on the way space is modeled. For a network, node points are considered. For a continuous space (surface), grid points are considered. In particular, when a raster model of the space is used, points become pixels of the raster image and are dependant on the adopted grid resolution.
Equation (1) is essentially a weighted linear combination, one of the aggregation procedures available in the context of multi-criteria evaluation. This combination approach allows a trade-off of criteria qualities, implying that compensation for poor quality is achieved by having a number of stronger qualities. Other aggregation approaches, like the ordered weighted average, allow some control over trade-off and incorporate the effect of risk attitude in the evaluation process.
An important component of a multi-criteria evaluation model concerns the priorities attached to various criteria, i.e. the values of weights wj in equation (1). The objective of developing weights is to quantify the relative importance of criteria to one another in terms of their contribution to an overall accessibility index. Among the methods that are used to derive the weights established and used by different authors, two are most common. These are the n-points scale (originally the seven-points scale), and a more complex method called pair-wise comparisons.
Because of different scales upon which criteria are measured, it is necessary to standardize them prior to aggregation. The process of standardization is essentially identical to that of "fuzzification in fuzzy sets." The objective is to transform any scale to a comparable one measured according to a standardized range (e.g. 0-1). In our case, the result expresses a membership grade that ranges from 0.0 to 1.0, indicating a continuous variation from non-membership (no accessibility) to complete membership (maximum accessibility) on the basis of the criterion (distance) that is being fuzzified (Figure 1).
Depending on the nature of the criterion being fuzzified, different fuzzy functions can be selected. Among those most used are sigmoidal (S-shaped), J-shaped, linear, and complex.
When fuzzifying distance variables, the sigmoidal monotonically decreasing function (Figure 1) is one of those most commonly used for instances where membership grade (i.e. standardised value) is given by: Control points a and b (Figure 1) are critical points that should be set for each particular situation, considering their inherent meaning. A GIS-based Multi-criteria Accessibility Model
The formal model presented in the previous section can be implemented within a GIS environment, making use of algebraic map functions. The first step is to create cost-distance maps for each of the key destinations. The flowchart in Figure 2 shows the sequence of operations that are required. On one hand, a slope map is derived from a digital elevation model (DEM). Then a reclassification operation produces the off-road friction map. On the other hand, the road friction map is derived directly from a road map. The overlay of these two friction maps shows its result in the final friction surface, which is then combined with each of the key destination maps to give us cost-distance maps.
Having cost-distance maps for each key destination, the multi-criteria procedure is implemented following the flowchart of Figure 3. The sequence of operations starts with the standardization (i.e. the application of the selected fuzzy-set functions) followed by the weighting. Thereafter the weighted, standardized cost-distance maps are overlaid to give us the final accessibility map. A Model for Northwestern Portugal
In order to use the accessibility evaluation model established here, the model must be customized to the particular context under study. This means: (i) to identify the set of key destinations; (ii) to establish the weights for each key destination; (iii) to identify the fuzzy-set functions to be used; and (iv) to set the control points a and b for the fuzzy-set functions.
In the context of an industrial location study for northwestern Portugal, a panel of 25 industrial entrepreneurs was interviewed regarding the relevant criteria involved in their decision-making processes. These criteria were divided into three main classes: factors associated with industrial activity, factors associated with administrative and socio-economic options, and factors associated with physical planning. Among the elements of the first criteria class, accessibility was considered the most important.
Results of the interviews as to accessibility are presented in Table 1, with answers to the four points stated earlier in this section. Weights were derived by a pair-wise comparison procedure undertaken with each entrepreneur, followed by average and normalization. The sigmoidal (monotonically decreasing) fuzzy function adopted was almost unanimous, and control-point distances were an averaging of the entrepreneurs' opinions. Case Study: Multi-criteria Accessibility Evaluation in Valena, Portugal
The aforementioned model was applied to create an accessibility map (for industrial location purposes) of Valena, a municipality located in northwestern Portugal. The model was implemented in IDRISI, a raster GIS software program that provides a full cartographic modeling toolbox, including extensive algebraic map functions, surface analysis functions, distance functions, and decision support functions.
The flowchart of the spatial analysis operations conducted within the GIS environment is presented in Figure 4 (friction surface) and Figure 5 (accessibility surface).
All the images were built with a resolution of 20x20 meters, which resulted in 289,122 pixels for the 115.6 square kilometers of the study area.
To take advantage of the 256 colors that were provided by the software palette, cost-distance images were standardized on a continuous scale that ranged from zero to 255. A score of 255 meant maximum accessibility, and a score of zero meant no accessibility. The resulting standardized images ROAD_FUZ, MOTO_FUZ, TRUC_FUZ, RAIL_FUZ, SEAP_FUZ, and AIRP_FUZ are presented in Figure 6, and the corresponding histograms of frequencies (of the pixel values) are presented in Figure 7. In order to improve readability, histograms start with accessibility score 1, thus hiding the frequency of zero scores.
Finally the accessibility map for Valena is shown in Figure 8, where a generalized image is presented together with the histogram of frequencies. An analysis of Figure 6 shows that the six key destinations contribute differently from the overall accessibility index. An initial global observation suggests that the northwestern part of the study area scores higher for accessibility. This is not surprising since the motorway junctions, and the truck and the railway terminals, are situated in the western and northwestern sectors. In addition, there is a hill area that crosses the study area from east to northwest, characterized by steep slopes and a lack of roads.
A deeper analysis of the images of Figure 6, together with the histograms of Figure 7 and the statistics of Table 3, suggests the following:
a) Standardization affects each image differently due to different control points of the fuzzy function, thus resulting in different sizes of the black areas (zero scores)
b) Due to road density and the existence of two motorway junctions, accessibility is high in most of the study area; it is evident in the histograms of Figure 7 that there is a concentration of high scores in the roads and motorway images, which correspond to mean scores of 149 and 157 respectively
c) In spite of being located not far from each other, the truck and railway terminals have quite different score surfaces; in fact, the fuzzy function control point b for the truck terminal distances is half of that for the railway terminal (10.40km versus 20.08km), which results in different histograms and mean values (44 for the truck and 114 for the railway)
d) Seaport and airport terminal images have middle to low scores, due to the fact that these facilities are located around 35km away from the study area; this geographical situation is reflected in the mean values of the score histograms (26 for the seaport and 60 for the airport).
Regarding the final accessibility map of Figure 8, the pattern described above does not change significantly. Combinations of scores result in a surface with scores that range from zero to 242, with a mean value of 122, and 15.2 percent of the area has a score of zero. The reclassified image (Figure 8b) shows a score distribution of irregular rings centered in the northwestern part of the study area, with two deformation sources due to the presence of both the southern motorway junction and the hill area. Conclusions
Industrial location requires the selection, evaluation and combination of several factors. Some of these factors are closely associated with the accessibility of possible location alternatives.
In this article, a multi-criteria accessibility evaluation model was developed within a GIS context and specified for a particular area of northwestern Portugal.
The proposed model calculates an accessibility index given by the weighted summation of cost-distances to a number of key destinations.
As to the case study, two conclusions can be drawn. First, from the point of view of the group of Portuguese industrial entrepreneurs, the most important accessibility factor is proximity to main roads, followed by proximity to motorway junctions and to truck freight terminals. Railway, seaport and airport freight terminals are less important in terms of industrial location decisions, illustrating how much the Portuguese economy relies upon road transportation. Second, applying this model to the municipality of Valena shows its overall feasibility, and these results have proved to be a useful piece of information to support decision-making, comprising maps, histograms and respective statistics. About the Author:
Jos F. G. Mendes is a member of the Department of Civil Engineering at the University of Minho in Braga, Portugal. He may be reached via e-mail at [email protected]. Back |

