| Fly-through Data Generation of Afghanistan
By Dr. Philip Cheng and Laurie McBean Introduction
Afghanistan seemed to fade from the international spotlight almost immediately after Soviet military forces withdrew in 1992. In the years that followed, global attention, which had centered upon this region for so long, quickly seemed to disappear as the eyes of the world and the international media began to focus on other areas of conflict. It was a time of many changes - social, political, economic, technological, and environmental. 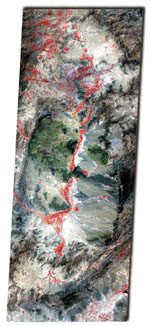 Stitched composite ASTER image of band 3N, 2, and 1 of Afghanistan. Stitched composite ASTER image of band 3N, 2, and 1 of Afghanistan.
However, since the events of September 11, much of the world's attention has followed the trail of those believed to be responsible, once again focusing on this small Central Asian country. In the days following those attacks, many people, organizations and news agencies began looking for recent images, maps, and any other information on Afghanistan. Questions were immediately raised that included, "Where is Afghanistan, and where are its major population centers?" "What has happened in Afghanistan over the past decade?" "What is the geography of Afghanistan and how does its terrain affect its economy and its citizens?" And last, but certainly not least, "Where can we get recent image data or aerial photographs of Afghanistan?"
Most of the public's initial questions could be answered through the news media and via the Internet. However, finding precise geocoded satellite imagery (ortho-imagery) of Afghanistan was not easy. It is too dangerous a task to collect ground control points (GCPs) onsite. In addition, digital elevation models (DEMs), which are necessary for creating a precise geocoded image, were not readily available at a high enough level of accuracy. This problem exists in many countries worldwide, and in many situations where precise GCPs and DEMs are too difficult or even too dangerous to acquire manually.
Fortunately, with the successful launch of the Terra satellite in December 1999, it is not only possible to view satellite imagery of any country at 15-meter resolution through the ASTER (Advanced Spaceborne Thermal Emission and Reflection Radiometer) sensor, but also to generate precise ortho-images and DEMs through the stereoscopic capability of that sensor. Most important of all, the data is freely available to all users. In this article, we will demonstrate how ASTER satellite imagery of Afghanistan was used to generate DEMs and ortho-imagery. It will then be shown how these derivatives were used to generate a perspective scene and animated "fly-throughs" of the terrain. Using such data has many immediate and obvious advantages, including the ability to allow pilots to fly over hazardous or hostile areas at low levels without actually traveling into harm's way. This form of mission preparation may be completed quickly and with an extraordinarily high level of accuracy. An Afghan Profile
Afghanistan is a mountainous, land-locked country located in Central Asia, occupying an area of about 647,500 square kilometers. The climate is arid to semiarid, with cold winters and hot summers. Rugged mountains dominate the terrain, with plains in the north and the southwest. The lowest point of elevation is at Amu Darya (258 meters), with the highest point at Nowshak (7485 meters). The nation's principal resources include natural gas, petroleum, coal, copper, chromite, talc, barites, sulfur, lead, zinc, iron ore, salt, and precious and semiprecious stones.
Afghanistan has a history and culture that goes back more than 5000 years. Throughout its long, splendid, and sometimes chaotic history, this area of the world has been known by various names. In ancient times its inhabitants called the land Aryana. In the medieval era, it was called Khorasan, and in modern times, its people chose to name it Afghanistan ('Land of the Afghan'). The exact population of Afghanistan is unknown; however, it is estimated at between 21 million and 26 million people.
A heterogeneous nation, Afghanistan's four major ethnic groups are Pashtun, Tajik, Hazara, and Uzbek. Numerous other minority ethnic groups (Nuristani, Baluchi, Turkmen, etc.) also call Afghanistan home. The vast majority of Afghans (99 percent) belong to the Islamic faith; however, there are small pockets of Sikhs, Hindus, and even some Jews. The official languages of the country are Pashto and Dari (Afghani Persian). The capital of Afghanistan is Kabul, which remains shattered and destroyed after many decades of war. However, throughout history, Kabul was admired by many great figures such as the famous Central Asian conqueror, Zahirudeen Babur. Today, Afghanistan is in a disastrous state: the economy is in ruins, its people are dying of war and hunger, and its neighbors are taking advantage of its instability. The ASTER Instrument
ASTER is an imaging instrument flying aboard Terra, a satellite launched in December 1999 as part of NASA's Earth Observing System (EOS). ASTER is the only high-spatial-resolution instrument on the Terra platform. It is being used with MODIS, MOPITT, MISR and CERES, which monitor the Earth at moderate to coarse spatial resolutions. A joint U.S./Japan science team was responsible for instrument design, calibration and validation. Details are available on the Web at http://asterweb.jpl.nasa.gov. The primary objective of the ASTER mission is to obtain high-spatial-resolution images - local, regional and global - of the Earth in fourteen spectral bands. ASTER consists of three different subsystems: the Visible and Near Infrared (VNIR, 15m), the Shortwave Infrared (SWIR, 30m), and the Thermal Infrared (TIR, 90m).
The VNIR subsystem consists of two independent telescope assemblies that minimize image distortion in the backward- and nadir-looking telescopes. The focal plane of the nadir telescope contains three silicon-charged, coupled detector line arrays (Bands 1, 2, 3N), while the focal plane of the backward telescope has only one such array (3B). This backward- and nadir-looking telescopic pair is thus used for same-orbit stereo imaging (along-track stereo). The two near-infrared spectral bands (3N and 3B) generate an along-track stereo image pair with a base-to-height (B/H) ratio of about 0.6, and an intersection angle of about 27.7 degrees. The two telescopes can be rotated plus-or-minus 24 degrees to provide extensive cross-track pointing capability and a five-day revisit capability. Across-track stereo imaging with a better B/H ratio is theoretically possible. However, due to the high data rate of the three ASTER imaging subsystems only eight minutes of data are acquired per orbit, and the along-track stereo imaging is then favored.
The release of ASTER data has had two significant impacts. First, the data can be downloaded free of charge from the Web (see http://asterweb.jpl.nasa.gov). Second, it provides a new alternative for mapping at medium-to-large scales and for generating DEMs from the along-track stereo data. This simultaneous along-track stereo-data acquisition provides a strong advantage in terms of radiometric variations versus multi-date stereo-data acquisition with across-track stereo, which can then compensate for the weaker stereo geometry. Since an error of within plus-or-minus one pixel has been achieved for the parallax measurements in the automated matching process - with different stereoscopic data sets, both along-track and across-track - the potential accuracy for the along-track, stereo-derived DEM from ASTER, with a B/H ratio of 0.6, could be on the order of 25 meters. Study Site and Data Sets
Our study site is Kabul, Afghanistan, and its surrounding areas. The elevation ranges from roughly 1800 to 4500 meters. Three ASTER-level 1A raw data scenes of the same satellite path, acquired on August 2, 2001, were downloaded directly from the USGS EROS Data Center Web site. Each data unit (61.5km by 63km) involves a reconstructed, unprocessed instrument digital count with a ground resolution of 15 meters. It also contains depacketized, demultiplexed, and realigned instrument image data with geometric correction coefficients and radiometric calibration coefficients appended, but not applied. The spacecraft's ancillary and instrument engineering data are also included. Radiometric calibration coefficients, consisting of offset and sensitivity information, are generated from a database of all detectors. Geometric correction is the coordinate transformation for band-to-band co-registration. Radiometric calibration coefficients were applied to each image in order to remove banding and striping effects.
Because the three images were acquired on the same satellite path with small overlaps between images, a special software solution was written to stitch the images together into one long, continuous strip that measured 61.5km by 183.6km. This stitching ensured that the final extracted DEM and ortho-image was continuous. As a result, the mosaicking of DEM or ortho-image was no longer required. To extract the DEM, only the VNIR nadir and backward images (3N and 3B) were used. Satellite Geometric Model and Software
PCI OrthoEngine software was used for testing. This software supports the reading of the data, ground control point (GCP) collection, geometric modeling, DEM generation and editing, orthorectification, and either manual or automatic mosaicking. The geometric model used within the software is a rigorous (parametric) one developed by Dr. Thierry Toutin at the Canada Centre for Remote Sensing (CCRS), Natural Resources Canada. This model is based upon principles relating to orbitography, photogrammetry, geodesy, and cartography. It reflects the physical reality of the complete viewing geometry and corrects distortions that occur in the imaging process due to platform, sensor, Earth, and cartographic projection conditions. It has been successfully applied with few GCPs (from three to six) to VIR data (Landsat, SPOT, IRS, MOS, KOMPSAT, IKONOS), and also to SAR data (ERS, JERS, SIR-C, RADARSAT). Based upon good-quality GCPs, the accuracy of this model was proven to be within one-third of a pixel for VIR images, and within one resolution cell for SAR images. Because of the lack of precise ground control information for Afghanistan, only 20 tie points were collected between the 3N and 3B images to generate this model. DEM Results
Automatic DEM generation software was developed at PCI Geomatics. This software can also be used to generate DEMs from aerial photos and such satellite stereoscopic sensors as IKONOS, IRS, SPOT, and RADARSAT. After rigorous models (collinearity and coplanarity equations) are computed for the 3B and 3N images, a pair of quasi-epipolar images are generated from the images in order to retain elevation parallax in only one direction. An automated image-matching procedure is used to produce the DEM through a comparison of the respective gray values of these images. This procedure utilizes a matching method of hierarchical sub-pixel, normalized cross-correlation to find the corresponding pixels in the left and right quasi-epipolar images. The difference in location between the images gives the disparity or parallax arising from the terrain relief, which is then converted to absolute elevation values above local mean sea level by using a 3D space-intersection solution. If GCPs are not available, the user can simply collect tie points (TPs) between the stereo pair. Although the extracted DEM will not be as accurate as the results using GCPs, it is still a far better choice for areas where accurate GCPs and DEMs are not available at all. The NASA EOS Land Processes Distributed Active Archive Center (DAAC), located at the USGS EROS Data Center, is currently using OrthoEngine software by PCI Geomatics to produce EOS Standard Data Product DEMs from stereo ASTER data.
This DEM was generated at 30-meter resolution with the highest possible level of detail. The overall quality of the DEM was found to be quite good, with very few correlation artifacts and a minimum of failed areas. Minimal manual editing was necessary to fill in areas where correlation had failed. It took approximately two hours to generate the DEM on a Pentium 900MHz machine, with less than 10 minutes spent in quality control and manual editing. Perspective Scene and Fly-Through Generation
The three-band VNIR nadir-looking image was orthorectified using the extracted DEM. Because ASTER does not include a blue band with its VNIR channels, it is not possible to show a natural color view of the ground. The default color range includes green, red and infrared. This factor causes terrain to look blue-purple, with vegetation shown in red. In order to provide a more intuitive view of the geography, a pseudo-true-color image was generated. Similar to algorithms developed for SPOT 4 images, the green band was shifted to blue, and a pseudo-green band was created from a 50 percent combination of the green and infrared bands. This new band highlights vegetation signatures and therefore provides a pseudo-true-color image, with vegetation shown in green.
The DEM was resampled to 15 meters to exploit full ortho-image resolution during rendering. The DEM and ortho-image were subset to common bounds, and to a database size that was efficiently rendered by using FLY! Software developed by PCI Geomatics. FLY! is a visualization tool that renders perspective scenes from elevation and image data. Successive scenes can be rendered quickly by using optimized algorithms to simulate flying through a data set. A sub-area that covers approximately two ASTER scenes were loaded and rendered on a Pentium machine with 512Mb RAM. Perspective scenes were then generated from a viewing height of approximately 1500 meters above the local terrain, with a horizontal tilt of 35 degrees from the horizon. The terrain was rendered in a fitted mode, with the pixel edges interpolated so that they fit together without step effects. In generating perspective scenes, it is common to exaggerate elevations in order to highlight the terrain. However, the Kabul area is so mountainous that no vertical exaggeration was applied.
The resulting perspective scenes demonstrate both the high quality of the DEM and the detail that could be successfully interpreted from the imagery. The ortho-image and the DEM were accurately co-registered, and the peaks of the rugged mountains were extracted with sufficient detail to accurately orthorectify the imagery. Considering the fact that ASTER data is free and accessible to users worldwide, the level of detail that can be discerned at a resolution rate of 15 meters was surprising. In the city of Kabul, airports, roads, and even large buildings such as mosques could be interpreted. Narrow mountain access roads were also easily identified, demonstrating the potential value of this data for planning and navigation purposes.
The generation of animated perspective fly-throughs of ASTER data can offer an even more effective view of the terrain by using a constantly changing viewpoint. Several flight lines were constructed for the Kabul data set, adjusting the view direction, flight speed, height above ground, and the ground track of the viewpoint. The perspective frames were rendered to a TIFF format at 15 frames per second. The individual TIFF frames were then assembled into an animated MPEG movie loop using shareware from Gromada.com called VideoMach. The MPEG file is compact, easy to distribute, and can be displayed on most media players. On a Pentium 1GHz machine with 512Mb RAM, perspective frame rendering required approximately two hours of processing time, and MPEG encoding required approximately 90 minutes of processing time to produce a final fly-through animation lasting about 90 seconds.
Pilots who have never been to Afghanistan can visualize flight paths through dangerous mountain ranges. Relief workers can understand the routes traveled by refugees within the country. The general public can obtain an impression of the geography of the country and understand the natural barriers that make military operations so difficult. The imagery shows an arid and desolate country with little infrastructure between cities. Vegetation is extremely sparse while agriculture, for the most part, is confined to narrow corridors along small rivers, many of which are nestled tightly in valley bottoms only a few hundred meters wide. Rugged mountain ranges are interspersed with vast desert plains, making travel formidable. This is indeed a land filled both with potential and challenges. Conclusions
The success of the ASTER sensor provides an economical opportunity for mapping at medium scales (1:100,000 and 1:50,000), and for extracting elevation information from nadir and aft images. The simultaneous along-track stereo data eliminates radiometric variations caused by multi-date stereo data acquisition while improving image-matching performance. In cases where precise GCPs cannot be obtained, it is possible to generate models through tie points alone. All mapping operations can be completed with a high degree of automation by using commercially available software. Open access to ASTER data archives provides the ability to respond quickly to data demands in most locations throughout the world. Perspective scenes and animated fly-throughs provide an intuitive image product that is ideal for public consumption. About the Authors:
Dr. Philip Cheng is a senior scientist at PCI Geomatics, Richmond Hill, Ontario, Canada. He can be reached via e-mail at [email protected]. Laurie McBean is an applications specialist at PCI Geomatics, Richmond Hill, Ontario, Canada. She can be reached via e-mail at [email protected]. Back |

