| Remote Sensing & GIS Promote Forest Monitoring in Russian National Parks
By Natalia Malysheva Abstract
Diverse ecosystems are unique, valuable for scientific research, picturesque, and attractive in a recreational respect. They are also more attractive for nature conservation and ecological tourism than are more typical ones. The existing network of Russian National Parks is a representation of these ecosystems. According to the Russian Nature Protection Law, primary tasks of national parks include conducting ecological monitoring, preserving unique nature areas, or restoring disturbed nature complexes. As the main ecosystem component in existing Russian national parks, forests are also considered to be the main indicators of unfavorable impact. 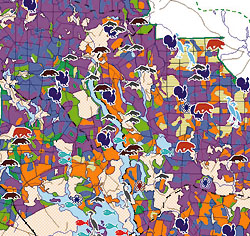 Figure 7. Biodiversity map of Valdai National Park. Figure 7. Biodiversity map of Valdai National Park.
Introduction
National parks promote nature preservation and the cultural heritage of a country. With its 35 national parks, Russia is very rich in outstanding nature landscapes, most undisturbed by human activity. Park areas vary in considerable range from ten thousand to millions of hectares. The largest - Yugyd-Va - with its virgin boreal forests, covers about two million hectares. The smallest - the Curonian Spit - with its unique landscape mosaic of forests and sand dunes, covers only 7900 hectares.
Unlike parks in many other countries, housekeeping activities in Russian national parks are permitted only to the extent of maintaining ecosystems in conditions that are attractive to visitors. National parks services take care of preservation or restoration of unique and picturesque ecosystems as intended for tourism, recreation, and ecological education. Ecological monitoring of a territory provides valuable information for management of these parks. As the main element of natural complexes for many Russian parks, forests are the main objects of concern in ecosystem monitoring.
The value of information as provided by monitoring in Russian parks goes beyond national boundaries. This information is a very important part of long-term observations for international research programs on global climate changes, biodiversity, and the global observation of forest coverage. It is also a basis for estimating the sustainability of human activities indices. In this context, when performing research in Russian national parks, one must consider internationally adopted criteria and indicators.
Presented here is a set of aggregate indices that meet the requirements of international criteria, as well as indicators of sustainable impact on the environment in protected areas. Remote sensing information was a primary source for data collection. Monitoring Strategy
A monitoring strategy was developed separately for each specific park. In every case an analysis was performed on the park's area, environmental conditions, the degree of ecosystem preservation, and the urgency for action in the overall protection of nature. Such approaches to monitoring were as diverse as the parks themselves. This principle of differentiation, together with monitoring objectives, also applied to observation design. For example, three observation levels were involved in a full-scale monitoring system. These included space images, airborne surveys, and ground plots. In the case of remote regions, with virgin forests undisturbed by recreation and human activity, data collection - the overall estimation of the degree of preservation and ecosystems dynamics - was limited to a space-image analysis. Additionally, certain survey techniques, scales and spectral ranges were chosen in order to make damage assessments, identifying not only forest stands as a whole, but tree pathology as well.
The principle of selective surveys with respect to monitoring objectives helped to select the most effective territory monitoring plan, to estimate ecosystem preservation degree, and to conduct a detailed study of areas with anomalous aggregate indices or unfavorable trends.
Territory monitoring planning also used the principles of stratification, the specification of the sampling units and methods of selecting those units, also with respect to monitoring objectives.
A monitoring system was designed to be implemented in phases: first the planned observation, then selection of a data collection method, and finally interpretation and summarizing of the results.
Stratification implied a division of an area into long-term sampling units in order to obtain aggregate indices and then detailed data. Area stratification was based upon either ecological or human activity characteristics. The ecological approach to stratification assumed that a territory was divided into relatively homogeneous formations, such as river basins and landscape complexes. The administrative approach assumed that the territory was divided into so-called functional zones (zones of certain conservation, protection, and land-use regimes) and was desirable primarily for administrative and economic purposes. The use of GIS applications made it possible to present monitoring results in both of these two spatial frames. Monitoring Methods
The wide geographical variety of these research areas made it possible to test different monitoring methods. Experiments were conducted in different geographical subregions: from the smallest among Russian National parks, the Curonian Spit, to the largest in the European part of Russia, Vodlozero Park. The following gives a more detailed description of these methods.
The evaluation of ecosystems conservation and its dynamics for Vodlozero Park was made through the analysis of space images. Vodlozero is the last undisturbed wetland taiga complex of such considerable size (about 500,000 hectares) in Europe.
Multi-temporal RS information consisted of the following:
• CIR space photos obtained in 1978 from the Kosmos satellite, in a scale of about 1:250,000, with a resolution of from five to 10 meters
• CIR space photos obtained in 1992 from the Resours-F satellite, in a scale of about 1:800,000, with a resolution of 20 meters
• Multispectral scanner images (MSU-SK) obtained in 1998 from Resours-O, with a resolution of about 150 meters.
The space images were processed by means of a two-stage classification system using IDRISI software. Uncontrolled classification was carried out at first. Then the images were classified based upon their maximum match to reference areas. The identification error did not exceed 10 percent for all classes. The processing results for test areas are illustrated in Figures 1 and 2.
The areas (pixels) of the classes of identified objects were calculated based upon the results of multitemporal image classification. Then indices reflecting each park's peculiarities in its ecosystem and its specific characteristics (e.g., percentage of forest cover, share of bogs, share of water surfaces) were then estimated. The indices were calculated for the park as a whole, for strata corresponding to river basins of a certain order, and for test areas with unfavorable ecosystem dynamics. In order to conduct these calculations, the images were superimposed on the boundaries of parks and river basins - the layer produced by means of ARC/INFO.
The comparison of indices obtained from space images in 1978, 1992 and 1997 is of great interest for evaluation of ecosystem conservation and dynamics as caused by natural and human factors. The interval between observations was 14 and 19 years respectively.
The monitoring objective in the central part of the park was the conservation of virgin boreal ecosystems. The analysis of indices from space images of different years has shown that the area of bog complexes had increased by 15 to 30 percent. On the contrary, the percentage of forest coverage had decreased. This unfavorable trend in boreal ecosystems dynamics was probably a result of a worsening hydrological regime, growing bog areas, and the changing of forest resourcefulness and ecological potential (Fig. 1).
A disturbed balance in natural complexes was also registered in another test area, the park's buffer zone. This strictly protected zone of the park adjoins the buffer zone that was formerly disturbed by intense logging. The comparison of aggregate indices (see table) led to a conclusion about changes in natural complex balance at the test site. Considering the length of park boundaries, the effect of industrial activity on the buffer zone was best evaluated by space image analysis. Table. Aggregate indices for Vodlozero National Park buffer zone
The above results proved the disturbance of the hydrological regime due to intense harvesting. The expansion of clear-cutting up to strictly protected zones within the park became evident when the classification results were overlaid with the layer of vector boundaries (Fig. 2). The lack of space data for the territory in question made it impossible to reach an accurate conclusion as to which year the clear-cutting actually took place. The harvesting could have taken place either before or after the park was founded in 1991. Most probably, the blocks from a neighboring forest that exhibited clear-cutting were assigned to the park's territory the year it was formed. Clear-cutting in the buffer zone did not appear on space images beginning in 1997. Compared to the situation in 1992, forest areas increased by 15 percent due to regeneration of clear-cutting areas over a span of five years. At the same time, bog areas increased by seven percent, and by 12 percent during the past 19 years. Changes in the balance of these indices prove the disturbance of the hydrological regime as caused by past harvesting.
Space-image-aided ecosystem monitoring showed the necessity for detailed research with more precise methods in the frontier park's territories. Figuratively speaking, the space images sounded the alarm, but more detailed methods, i.e., airborne survey and field observations, will help improve the reliability of information. Experimental studies show that space images are appropriate for the evaluation of gradual, long-term ecosystem dynamics that are caused both by natural conditions and human interference. Could these methods be used for small parks and, if yes, in what aspect of research? Let us illustrate the reasonable prospects for the space data applications in the context of the smallest Russian national park, the Curonian Spit.
The Curonian Spit belongs to the largest accumulative phenomena of the Baltic Sea. Continuous 300-meter-long sand dunes are up to one kilometer wide, and are among the highest in the world. These dunes stretch 70 kilometers along the peninsula. The divers-dune relief is combined with green forests, the bright whiteness of sandy beaches, and the deep blue of the Baltic Sea.
Multispectral SPOT imagery, gathered in 1996, was analyzed for this study. Two available controlled classification algorithms were used for SPOT analysis. These were maximum likelihood and Euclidean distance classifiers. Classification errors were estimated by control sampling with class models that were not involved in the study. These classification results are presented in Figure 3.
As a result of SPOT image classification, specific land categories were distinguished with the following rates of accuracy. Sand dunes without vegetation and water objects were identified with a probability of 1, agricultural land and dunes covered by vegetation with a probability of 0.96-0.98. The two classes of forest were identified with a probability of 0.8 for coniferous stands and 0.7 for deciduous stands. Although the coniferous stands could have been of either of two subdivisions, the probability of their identification did not exceed 0.55. This example demonstrates the usefulness of SPOT imaging for the preliminary stratification of park areas, and the planning of sampling aircraft observations.
Thus, multilevel data collection for monitoring determined the level of space images resolution. The high-resolution and medium-resolution scanner data (SPOT and Resours-O) was applied in the research of large park areas as a whole, and their zones. The high-resolution satellite images with five to 20 meters (SPOT, Resours-F, etc.) were preferable for planning, and later helped conduct a detailed survey of these test areas. Data Collection Based Upon a Digital Airborne Survey
For small parks with disturbed ecosystems - such as the Curonian Spit - the monitoring objective was for nature protection management and forest health assessment. Two observation levels were necessary, including an airborne survey and ground sampling. Airborne surveying, conducted by means of digital video or photo cameras, was an irreplaceable source of expeditious information for the park's service routines.
Modern digital survey equipment provided images with the appropriate resolution necessary for computer processing. Applicability of airborne video imaging depended upon the production of images in different scales, i.e., an overall view and detailed view, at the same time from the same aircraft heights due to the change of the lens focus during each flight. The overall view-observation level was similar to moderate scale aerial photography (1:10,000 to 1:15,000), and the detailed level was comparable to large-scale aerial photography (1:1000 and greater). The combination of data on two levels was helpful for evaluating forest sites and its characteristics. For example, it was possible to evaluate a disturbance degree for the forest as a whole, then to estimate the forest stands and, finally, to characterize the separate tree crowns. Video surveying is suitable for the monitoring of thinning cuts, regeneration and the state of forest plantings, recreational impact, the performance of nature protection measures, and overall forestry activity.
These video images served as a background for the placement of ground sampling plots, and for geo-referencing the detailed video frames in the GIS system. It was also suitable for correcting forest-site boundaries and the territorial division into zones with different industrial activities and nature-protection regimes.
Image mosaics, interpreted results and obtained indices were loaded into the GIS. Topographic maps, forest management planning maps, thematic maps, forest inventory data, and ground sampling data were also loaded. These data were used both separately and in combination with the video and photo information. As a rule, image interpretation was not regarded as a self-reliant process, but rather as a part of the complex data analysis via certain GIS capabilities. All information sources, including the video images, were overlaid onto basic topographic maps for accurate analysis. The rectified video mosaics were preferable for interpretation in GIS, but separate video frames were not.
Video images interpreted for forest monitoring was an interactive process that combined computer analysis and a specific expert's knowledge of the system used.
A raster background from video mosaics for a vector forest map of the Curonian Spit is shown in Figure 4.
For optimal effect, airborne surveying for forest monitoring purposes should take place once every three to five years, depending upon the speed of change. In the case of natural disasters, the observation system should be supplemented by efficient observations conducted in a shorter time span. For example, the forest stands of the Curonian Spit were damaged by a hurricane in the winter of 1999-2000. An efficient airborne video survey was done to evaluate the severity of wind damage. Three forest-stand classes were identified as a result of a video-image comparative interpretation done both before and after the hurricane.
Field observations must be included in any monitoring system, because remote sensing without common forest-stand characteristics is never adequate for sustainable parks management. For example, the interpretation of detailed images cannot provide data on changes in height and crown diameter, the regeneration ability of tree species, or information about forest health damage, pests or diseases. This down-to-earth data gathering is also needed for education and training, and thus for the perfection of video-image interpretation. GIS Application
GIS has recently been introduced to Russian forest management practices, and many national parks do not possess forest map databases as produced by common forest inventory and planning operations. Therefore, a digital map database should be prepared before conducting monitoring and visualizing outputs in map form. This is not a simple task, because forest maps are not practically referenced to the real coordinate systems of topographic maps. Organizational and technical difficulties, information source errors, and limitations peculiar to software packages were the reasons given for testing a variety of packages. In order to create a National Parks GIS, Mapinfo, TopoL and ArcInfo for WS were tested, and specific advantages of these packages were combined.
Digital map databases for several national parks were formed or adapted for use in monitoring practice. Adaptation means the rectification of information sources and georeferencing to a coordinate system of a topographic map basis. The constituent parts of the GIS are shown in Figure 5.
The methodology introduced will help carry out monitoring tasks that deal with forest health, fire protection, and forest management operations, all on a base of unified software and unified base maps. This principal will ensure the comparability and compatibility of the monitoring results.
The GIS application will provide cartographic support for park management. Advantages of GIS in spatial analysis and different map compilations as a result of monitoring will be illustrated in the examples of Vodlozero National Park and Valday National Park.
Visual representation of indices obtained from space images, in combination with map data, allowed the analysis of spatial ecosystem variations in river basins and across the functional zones of Vodlozero National Park. As a result, it was possible to conclude the sort of areas that were preferable for the development of recreation and ecological tourism.
Of paramount importance for national parks was the biodiversity analysis and mapping by means of various GIS applications. Diversity in flora and fauna was of specific concern for Valday National Park, where GIS and an attribute database were used to compile thematic maps.
This territory is situated in the northern part of the Valdai Upland and has a very complex and picturesque terrain that was formed during the last glacial epoch (Figure 6). The belt of large lakes, stretching from north to south, was one of the ancient stems of settlement of Northern Slavic tribes and formed the historic commercial routes within the European part of Russia.
These maps provided characteristics of natural complexes and biodiversity, including mammal habitats and the size of populations, forest and water bird species, sites of endemic herbal plants, and endemic fish species (Figure 7). The park staff collected basic information on biodiversity during common field observations.
The national parks monitoring system is currently in transition, from its research phase to one of practical implementation. The closest tasks at hand include GIS education of the staff, updating databases and loading the ancillary data, and further enhancement of monitoring systems with the assistance of their originators. About the Author:
Natalia Malysheva has a PhD in Geographical Sciences and is the head of Remote Sensing Methods Department of the All-Russian Scientific Research and Information Centre for Forest Resources (ARICFR), under the Russian Ministry of National Resources in Moscow, Russia. She may be contacted via e-mail at [email protected] Back |

