| DEM Generation with ASTER Stereo Data
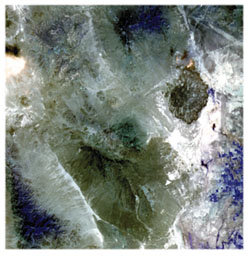
By Thierry Toutin and Dr. Philip Cheng Introduction Composite ASTER image of bands 1, 2 and 3N of the Drum Mountains, Utah (Figure 1).
 ASTER (Advanced Spaceborne Thermal Emission and Reflection Radiometer) is an imaging instrument that is flying on Terra, a satellite launched in December 1999, as part of NASA's Earth Observing System (EOS). ASTER is the only high-spatial-resolution instrument on the Terra platform. It will be used with MODIS, MOPITT, MISR and CERES, which monitor the Earth at moderate to coarse spatial resolutions. A joint US/Japan science team was responsible for instrument design, calibration and validation. Details are available on the Web at http://asterweb.jpl.nasa.gov. The primary objective for the ASTER mission is to obtain high-spatial-resolution (local, regional, and global) images of the Earth in fourteen spectral bands. ASTER consists of three different subsystems: the Visible and Near Infrared (VNIR 15m), the Shortwave Infrared (SWIR 30m), and the Thermal Infrared (TIR 90m). ASTER (Advanced Spaceborne Thermal Emission and Reflection Radiometer) is an imaging instrument that is flying on Terra, a satellite launched in December 1999, as part of NASA's Earth Observing System (EOS). ASTER is the only high-spatial-resolution instrument on the Terra platform. It will be used with MODIS, MOPITT, MISR and CERES, which monitor the Earth at moderate to coarse spatial resolutions. A joint US/Japan science team was responsible for instrument design, calibration and validation. Details are available on the Web at http://asterweb.jpl.nasa.gov. The primary objective for the ASTER mission is to obtain high-spatial-resolution (local, regional, and global) images of the Earth in fourteen spectral bands. ASTER consists of three different subsystems: the Visible and Near Infrared (VNIR 15m), the Shortwave Infrared (SWIR 30m), and the Thermal Infrared (TIR 90m).
The VNIR subsystem consists of two independent telescope assemblies that minimize image distortion in the backward- and nadir-looking telescopes. The focal plane of the nadir telescope contains three silicon-charge-coupled detector line arrays (Bands 1, 2, 3N), while the focal plane of the backward telescope has only one (3B). The backward- and nadir-looking telescope pair is used for same-orbit stereo imaging (along-track stereo). The two near-infrared spectral bands, 3N and 3B, generate along-track stereo image pair with a base-to-height (B/H) ratio of about 0.6, and an intersection angle of about 27.7 degrees. The two telescopes can be rotated plus-or-minus 24 degrees to provide extensive cross-track pointing capability and five-day revisit capability. Across-track stereo imaging with a better B/H ratio is theoretically possible. However, due to the high data rate of the three ASTER imaging subsystems, only eight minutes of data are acquired per orbit, and the along-track stereo imaging is then favored. The release of ASTER data has two significant impacts. First, the data can be downloaded free of charge from the Web, at http://asterweb.jpl.nasa.gov. Second, it provides a new alternative for mapping at medium to large scales and for generating digital elevation model (DEM) from the along-track stereo data. Digital Elevation Model
Producing Digital Elevation Models (DEMs) from satellite data has been a vibrant research and development topic for the last thirty years, beginning with the launch of the first civilian remote sensing satellite. Stereo viewing of images has been the most common method used by the mapping, photogrammetry, and remote sensing communities for elevation modeling. To obtain stereoscopy with images from satellite scanners, two solutions are possible:
• Along-track stereoscopy from the same orbit using fore and aft images
• Across-track stereoscopy from two different orbits. The latter solution has been applied more often since 1980 - first with Landsat from two adjacent orbits, then with SPOT using across-track steering capabilities, and finally with IRS-1C/D by "rolling" the satellite. In the last several years, the first solution has gained renewed popularity due to the JERS-1's Optical Sensor (OPS), the German Modular Opto-Electronic Multi-Spectral Stereo Scanner (MOMS), and now ASTER.
The simultaneous along-track stereo-data acquisition gives a strong advantage in terms of radiometric variations versus the multi-date stereo-data acquisition with across-track stereo, which can then compensate for the weaker stereo geometry. Since an error of within plus-or-minus one pixel for the parallax measurements in the automated matching process has been achieved with different stereoscopic data sets (along-track and across-track), the potential accuracy for the along-track stereo derived DEM from ASTER, with a B/H ratio of 0.6, could be in the order of 25 meters.
The main objective of this article is to evaluate automatic DEM generation and accuracy using a stereo pair of ASTER data. The results were then compared with the USGS 7.5-minute DEM with a grid spacing of 30 meters. Study Site and Data Set
The site for this study is of the Drum Mountains, located in west-central Utah. The area is semi-arid with few cultural features and little vegetation. The topography at the study site is 40 percent steep-and-rugged, and 60 percent relatively flat, with elevation ranging from roughly 1300 to 2600 meters above sea level. Acquired on July 31, 2000, with the VNIR subsystem from a descending orbit, the ASTER Level 1A raw data were directly downloaded from NASA's web site. These data (61.5 km by 63 km) are reconstructed, unprocessed instrument digital counts with a ground resolution of 15 meters. The site also contains depacketized, demultiplexed, and realigned instrument image data with geometric correction coefficients and radiometric calibration coefficients appended, but not applied. The ancillary and instrument engineering spacecraft data are included as well. The radiometric calibration coefficients, consisting of offset and sensitivity information, are generated from a database for all detectors. The geometric correction is the coordinate transformation for band-to-band co-registration. Only the near-infrared backward and nadir images (3B and 3N) are used in the DEM generation. The radiometric calibration coefficients were subsequently applied to both images to remove banding and striping effects. Satellite Geometric Model and Software
PCI OrthoEngine software was used for testing. This software supports reading of the data, ground-control-point (GCP) collection, geometric modeling, DEM generation and editing, ortho-rectification, and either manual or automatic mosaicking. The geometric model used inside the software is a rigorous parametric model developed by this author at the Canada Centre for Remote Sensing (CCRS), Natural Resources Canada. This model is based on principles relating to orbitography, photogrammetry, geodesy, and cartography. It further reflects the physical reality of the complete viewing geometry, and corrects distortions that occur in the imaging process due to the platform, sensor, Earth, and cartographic projection. This model has been successfully applied with few GCPs (from three to six) to VIR data (Landsat, SPOT, IRS, MOS, KOMPSAT, and IKONOS), and also to SAR data (ERS, JERS, SIR-C, and RADARSAT). Based upon good-quality GCPs, the accuracy of this model was proven to be within one-third of a pixel for VIR images, and within one resolution cell for SAR images.
This author also developed the automatic DEM generation software at PCI. It can be used to generate DEMs from aerial photos and such satellite stereoscopic sensors as IKONOS, IRS, SPOT, and RADARSAT. After the rigorous models (both colinearity and coplanarity equations) are computed for the 3B and 3N images by using a minimum of six ground control points (GCPs), a pair of quasi-epipolar images are generated from the images in order to retain elevation parallax in only one direction. An automated image-matching procedure is then used to produce the DEM through a comparison of the respective gray values of these images. This procedure utilizes a hierarchical sub-pixel normalized cross-correlation matching method to find the corresponding pixels in the left and right quasi-epipolar images. The difference in location between the images gives the disparity, or parallax, arising from the terrain relief, which is then converted to absolute elevation values above the local mean sea level datum using a 3D space-intersection solution. DEM Results and Analysis
Eight stereo GCPs and six independent checkpoints (ICPs) were collected from the stereo pairs. GCPs were collected from within the border of the images, and at the high and low elevation points, to avoid planimetric and elevation extrapolations. ICPs were then collected from inside the areas bounded by the GCPs and were not used in the computation of the geometric model. The GCP cartographic coordinates were collected using DGPS with plus-or-minus one-meter accuracy. Table 1 gives the full statistical results over GCPs/ICPs (root mean square and maximum residuals/errors) of the stereo-model computed only with the GCPs.
Table 1: Statistical results over GCPs/ICPs, with the root mean square (RMS) and maximum residuals/errors of the stereo-model computed with the eight GCPs and six ICPs.
These errors are a little larger than the residuals but in the order of GCP plotting accuracy (a little better than one pixel), and maximum errors are less than two times RMS errors. As a result, the mathematical model properly describes the stereo-viewing geometry, and is stable and robust for the full stereo-model without generating local or systematic errors. GCP residuals can thus be used as a priori stereo-mapping error in operational environments.
The DEM generation that included quasi-epipolar image generation, image matching and filtering, and geocoding took approximately 90 minutes on a Pentium III 933MHz computer. The generated DEM was then compared with an USGS 7.5-minute DEM (grid spacing at 30 meters) obtained from the USGS web site at http://edcftp.usgs.gov. Only a single USGS DEM for the test site was available from that web site. USGS 7.5-minute DEM is derived either by digitizing USGS 1:24,000 scale quad maps (which gives less-accurate results), or by scanning aerial photographs. The old 7.5-minute DEM has a RMS error of 15 meters and a maximum error of 50 meters. Most of the 7.5-minute DEMs (and all of the new ones) have an RMS error of 7.5m.
Because only one USGS DEM was available, 150,000 of the four million stereo-extracted elevation points were used to compute the statistics between the ASTER-extracted DEM and the USGS DEM. Sixty percent of the elevation points are within a difference of five meters, 83 percent are within a difference of 10 meters, 90 percent are within a difference of 17 meters, and 99 percent are within a difference of 50 meters. In summary, the elevation difference has a minimum value of minus-109 meters, a maximum value of 155 meters, a mean value of 1.9 meters, a median value of minus-one meter, and a standard deviation (STD) of 11.8 meters, all with a level of confidence of 85 percent. The largest differences occurred in the mountainous areas. Part of these errors includes the error of the USGS DEM. When compared to the previous estimation of the elevation accuracy (25 meters) based upon a normal one-pixel image matching accuracy, these elevation results (STD of 11.8 meters) correspond to better-than-half-pixel matching accuracy. These improved results can be attributed to the good quality of these data and the radiometric calibration of the detectors, but mainly to the conditions of this study site, which was semi-arid with few cultural features, very little vegetation, and a lack of forest cover. According to these results, contour lines with an interval of 30 to 35 meters could be derived from the DEM. Conclusions
The success of the ASTER sensor provides an economical opportunity for mapping at medium scales (1:100,000 and 1:50,000) and for extracting elevation information from nadir and aft images. The simultaneous along-track stereo data eliminates the radiometric variations caused by multi-date stereo data acquisition, while improving the image matching performance. Given accurate GCPs, it is possible to generate stereo-DEMs with good accuracy (better than 25 meters). When the images and study site are optimal - such as with this semi-arid study site in Utah - accuracy can be achieved as high as 10 meters and 17 meters with 83 percent and 90 percent levels of confidence, respectively. Consequently, 30-meter contour lines can be derived from the extracted DEM. The NASA EOS Land Processes Distributed Active Archive Center (DAAC), located at the USGS EROS Data Center, currently use this method and the PCI OrthoEngine software to produce EOS Standard Data Product DEMs from stereo ASTER data. About the Authors:
Dr. Thierry Toutin is a principal research scientist at the Canada Centre for Remote Sensing, Natural Resources Canada, Ottawa, Ontario, Canada. He may be reached via e-mail at [email protected]. Dr. Philip Cheng is a senior scientist at PCI Geomatics, Richmond Hill, Ontario, Canada. He may be reached via e-mail at [email protected]. Back |

