
|
 |
|
A
New Method for Classifying Remote Sensing Imagery: Ternary Multispectral
Analysis Abstract Clyde Spencer of Bio-Geo-Recon has patented a new method for classifying multispectral imagery–Ternary Multispectral Analysis. This process is not based on a typically statistical approach of creating thematic maps as employed by current software. Instead, it uses the virtual position of pixels on a ternary (triangular) diagram to represent the relative percentages of three key multispectral bands. This technique is especially applicable for the classification of Landsat imagery. It may also be used with hyperspectral and multispectral imagery that includes the appropriate bands.
One problem encountered when processing multispectral imagery is deciding which bands to use for displaying an image. Out of the half-dozen or so images that are commonly available from multispectral sensors, only three can be used at a time to create color images. There are some 120 permutations of six different bands, taken three at a time. If the bands that correspond to red, green and blue are used, a natural-color image can be created. However, these images often have a low contrast coefficient due to strong scattering of light in the green and blue bands. Vegetation is normally dark green, but colors are usually close enough to what we see in nature so that even laymen can identify the features being portrayed. However, multispectral and hyperspectral imagery are frequently displayed in what are called false-color images–the other 119 different permutations. In this process, objects are not the same color as what would be directly observed on the ground. Using some combination of infrared (IR) bands can certainly improve contrast and enhance color differences among different ground-cover classes. However, the resulting image is a false-color one and may be difficult to match with familiar objects. Experienced photo interpreters are comfortable when working with color composites that mimic camouflage-detection film (standard false-color IR). Unfortunately, laymen and those new to this process find red vegetation a little counter-intuitive, if not altogether off-putting. Also, the bands commonly used in standard false-color IR imagery (e.g., Landsat TM 4, 3 and 2) do not provide much discrimination between rocks and soil, since most geologic material tends to fall into shades of bluish-gray. One can choose to display the bands so that the near-IR band (Landsat TM 4) is displayed as green. With careful adjustment to the histograms, a near-natural-color rendition can be created that is easier to interpret and also provides fair discrimination of different vegetation types, typically showing clear water as a black mass. Figure 1 (Mono Lake, Calif.) is an example of this approach, using Landsat 7 ETM+ bands 7, 4 and 2. Unfortunately, soil and bare rock may have colors that are unrelated to their respective visual colors. To provide maximum discrimination of ground classes by using all the bands, one can perform a Principal Components (PC) transform of the multiple bands and select the three uncorrelated, transformed bands that have the greatest variance–hence the most information. Unfortunately, this exacerbates the problem of correlating scene colors with familiar objects or rock types on the ground. See Figure 2, a Landsat PC rendition of volcanic mountains in the Woolsey Peak Wilderness Area (Ariz.), for an illustration of this element. An extremely useful tool would be one that can assist in the identification of the multi-colored pixels that are associated with these often gaudy, but difficult to characterize images, and false-color images in general. Just such a tool, a recently patented technique, is described below. Most commercial image-processing software provides the ability to create scatter plots of two bands. This is presumably a tool to assist in the identification of ground classes. Unfortunately, the only scatter plot that is well studied and shown to be useful is a graphical variant of a simple vegetation index. If pixels are plotted so that the near-IR values are on the vertical (y) axis and the red values are on the horizontal (x) axis, the radial distance from the origin is the general red-IR brightness. A line drawn at approximately 45 degrees (commonly called the soil line) represents mostly soil pixels. The vertical pixels represent vegetation. Those that are intermediate may either be actual vegetation or else mixed pixels of soil and vegetation that would otherwise plot along the vertical or the diagonal line (see Fig. 3). This particular illustration is a plot derived from spectral libraries and shows the theoretical pixels of pure cover types. About all that one can realistically expect to learn about the land cover composition from this plot is whether something is organic or inorganic. In this instance, the pixels between the two extremes are regrettably ambiguous. Plots of other pairs of bands are usually less useful except perhaps for some specialized purpose, such as to create ratio bands. If additional bands could be plotted more information might be available, although displaying 3D plots on a 2D medium can result in graphics that are ambiguous and therefore difficult to interpret. Higher-dimensional plots are even more problematic. Another issue concerns the bands that will provide the most discrimination among land cover classes. Earth scientists and physical chemists have long used ternary diagrams (or ‘triangular plots’) to both classify minerals and soils of variable composition, and characterize stability fields in phase transitions. In a ternary diagram, the relative percentages of three components are plotted in an equilateral triangle, with the apexes representing 100 percent of each of the three different components. Since one can display only three bands at a time on a color computer display, a reasonable approach to analyzing graphical displays is to use a ternary diagram. However, the question must again be raised: "Which bands do we use?" For the six non-thermal bands in the Landsat TM or ETM+ sensors, there are 20 different combinations of six bands, taken three at a time. In other words, there are 20 unique ternary diagrams that can be derived from six different bands. Experiments with spectral libraries have shown that most of those 20 plots provide little or no discrimination of the different land cover classes, basically because of overplotting in the same feature space by highly different materials. Nonetheless, there are some plots that have proven to be particularly useful. Ternary Multispectral Analysis (TMA) is based on this observation. Those plots composed of one visible band (preferably TM band 2, since TM band 1 is less desirable due to stronger atmospheric scattering), the near-IR band (TM band 4), and a short-wave IR band (preferably TM band 7, since TM band 5 is less desirable due to fewer inorganic absorption features). When one plots on a ternary diagram the relative percentages of the apparent reflectance for pixels in the preferred bands (see Fig.4), minerals are plotted along the line bisecting one of the apexes of the triangle. Vegetation is plotted along a line parallel to the bisector of another apex. Lastly, water and ice are plotted along a line that approaches the remaining apex. Desert soils tend to plot in the region where a mineral cluster is intersected by a vegetation cluster. There is also some overlap between desert vegetation and desert soil. However, using the ternary diagram with these recommended bands provides a rapid means of identifying the dominant reflector in most pixels, especially when one is dealing with either ratio images or Principal Component images. A further refinement is to assign colors to the points in the ternary diagram, with the 100-percent mineral apex in red, the 100-percent vegetation apex in green, and the remaining 100-percent apex in blue, thereby creating a general correspondence between point colors and the general land class. Interestingly, most of the common rock-forming minerals plot in the middle of the diagram and would therefore be a grayish color. Iron-bearing material that is often associated with ore minerals will plot reddish, and evaporites such as borates will plot midway between blue and green, thereby appearing as cyan. One can display an image that is composed of these percentages, although the contrast tends to be less than optimal. Also, doing a histogram stretch would distort the colors and thereby reduce the interpretability of the meaning of the color within the context of composition. A better approach would be to display an image in colors that provide the greatest discrimination–such as a PC transform–and simultaneously display a triangular plot (using the recommended bands) of all the pixels in the image, highlighting the image pixels that correspond to those within a certain region of the triangular diagram. An alternative method would be to simply display those points on the diagram within a selectable radial distance of the image cursor. With land cover class boundaries overlaid on the ternary diagram, even a layman can see what sort of material is associated with the cursor position. This approach can also be employed with hyperspectral data by using bands in the hyperspectral data set that correspond to the recommended multispectral bands. While hyperspectral systems have the potential to provide a more precise and accurate classification of ground classes than does any multispectral system, there are a number of barriers to achieving that goal. Once the data have been corrected for atmospheric absorption and scattering and converted from radiance to apparent reflectance, a match must be found for the apparent reflectance spectra of a pixel. For a match to be made, there must be a corresponding spectrum in the library to which the pixel is being compared. While there are three first-class spectral libraries for minerals–prepared by the USGS, JPL, and CSIRO respectively–there is no similarly comprehensive public-domain library for soil and vegetation. Also, hyperspectral sensors are not as readily available as are multispectral sensors. However, within the context of this article, the most serious drawback to the effective use of hyperspectral data for practical application is that it takes an expert to reliably classify an image. It is this author’s experience that the results of mineral classification are highly dependent upon the particular algorithms and spectrums used in such matching. The technique of spectral matching is not robust enough to routinely achieve one’s desired level of accuracy. In contrast, the ternary diagram provides surprisingly good general identification, even from Landsat data that has not had atmospheric corrections performed on it. This is because the relative positions of clusters in the feature space can be used for interpretation as well as absolute positioning. Surface reflectors are identified as unique groups and, ideally, species within that group are discriminated. In contrast, a simple Cartesian 2D plot of reflectance versus wavelength (spectrum) does not identify the material, requiring instead a library against which comparisons must be made. Anyone acquainted with spectra could recognize areas of vegetation but would be hard-pressed to identify specific plants. Similarly, an experienced remote-sensing phenomenologist who works with mineral spectra might be able to recognize a few common minerals because of their distinctive diagnostic absorption features, but probably would not be able to guess the identity of an unfamiliar material solely by plotting reflectance versus wavelength. Thankfully, TMA does not require one to be an expert to determine which materials are present. However, the process can also use matching against a spectral library to accomplish a more detailed analysis. Typically, ground-cover classifications that use multispectral data have been empirical, in the sense that so-called ground truth has been required to either select training sites for supervised classifications or else to recode classifications derived from unsupervised classifications. Often, spectra of targets are used in lieu of a spectral library when doing hyperspectral classifications. The ground truth is usually obtained from a combination of photo-interpretation by an experienced practitioner, or gathered by direct observation of one or more specialists on the ground. The underpinnings of the TMA approach are based on a theoretical primitive because the general classes are derived from spectral libraries. As spectral libraries are expanded and refined, so can this approach be refined. However, even with the present state of the art, relatively inexperienced remote sensing technicians can be expected to achieve the sort of results with multispectral (or hyperspectral) data formerly expected only of experts. This offers the potential to decrease the cost of services and thereby expand the market for remote sensing. One should use the tools that are "faster, better and cheaper" for any task. Spectral matching with hyperspectral data is unsurpassed for some applications. However, it may be overkill for other applications, especially those that are cost- and time sensitive, such as in agriculture. Ternary Multispectral Analysis (U.S. Patent No. 6,356,646) takes advantage of the fact that when particular multispectral bands are plotted on ternary diagrams, groupings are created to allow for the identification of the land cover class without direct comparisons to spectra, or for requiring ground truth. Classification by using the TMA method is inherently superior neither to the statistical methods developed for use with multispectral data, nor to the spectral matching approaches developed for use with hyperspectral data. Instead, it is simply another tool to be used in remote sensing that has advantages such as speed and the ability to be used by non-experts. However, any tool that increases the amount of information extracted from multispectral imagery also increases the remote sensing user base. It also reduces the barrier to entry for those individuals contemplating the use of remote sensing, since analysts need not be as experienced as was formerly the case. The potential for increasing the user base, along with the added software functionality as a marketing asset, should make remote sensing software vendors excited about adding this innovation to their product line. The potential for full automation of target detection should prove equally attractive to the worldwide remote sensing community. |
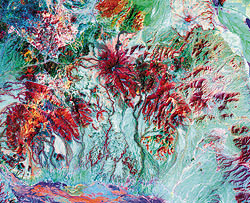 Figure
2. Principal Components analysis false-color rendition of Wooley Peak
Wilderness Area (Ariz.).
Figure
2. Principal Components analysis false-color rendition of Wooley Peak
Wilderness Area (Ariz.).