| Interactive Spatial Policy Analysis for Monterey County's General Plan Update
By Scott Akenhead, Edward Gregr, Jared Ikeda, Annette Chaplin and James Colangelo Monterey County (Calif.) has decided to update its general plan for the first time since 1982. The county began its public decision-making process to discuss issues the general plan must address, and also policy options for dealing with them. The county faces issues that continue to cause widespread concern, including the deterioration of highways and other infrastructure items, overdrawn water supplies that limit growth, and a shortage of affordable housing. Another major concern to many residents is the surge in both population and wealth in Silicon Valley, lying immediately to the north. Monterey County could well become a bedroom community both for the city of San Jose and for Santa Clara County. The general plan update (GPU) comes at a turning point in Monterey's history.
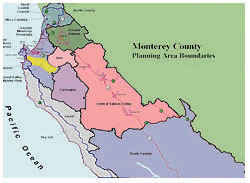 The planning areas within Monterey County have individual policy assignments that interact with the spatial analysis (Figure 1). The planning areas within Monterey County have individual policy assignments that interact with the spatial analysis (Figure 1). We separated the input of the public's objectives - identifying issues, strategic choices and understanding what the alternatives meant - from inputs from county planners: the tactics behind each strategic choice, costs, GIS analysis, technical impacts and side effects. Some of the policy choices were spatial, such as preserving agriculture, species' habitats, and encouraging compact housing. Other choices were non-spatial, such as investing in economic development, balancing the water supply, and increasing the overall level of service. These spatial and non-spatial policies continually interact, resulting in the creation of maps and tables that project conditions in the area to the year 2020. A specific goal is to predict where new population growth and new housing developments will most likely occur. Another is to evaluate the impact associated with the pattern of potential growth. Alternatives are created interactively by making strategic policy choices about key public issues. All these analyses and reports, including graphs of trade-offs across alternatives, are updated automatically.
The critical initial phase-building a consensus of opinion with the public-can be brought to closure by a constrained search among many possible alternatives, finding a result that best balances quality-of-life issues, environmental sustainability, and financial cost. Perhaps the greatest value of Monterey County's GPU framework is to show to the public the consequences of strategic choices, because this empowers the public to provide more informed, responsible input. Background:
Trade-off Analysis is the Key Delivery
Jim Colangelo, in charge of the general plan along with Annette Chaplin and Jared Ikeda, identified the key delivery as trade-offs across alternative plans in terms of social, environmental, and economic costs. (Figure 2) In other words, which development alternative would provide the highest "quality of life" to the residents of Monterey County? What will it cost, and can it be sustained?
To respond, we implemented a web-based alternative evaluation framework that presented the county's issues within the context of California's general plan guideline elements, and related planning alternatives to those issues and elements. Alternatives Evaluation
The framework evaluated the financial, technical, and social impacts of various development alternatives. The alternatives were ranked according to their scores in these categories. The methods for calculating the scores were made accessible via the Internet for ease of inspection.
The impact analysis for new policy choices was automated. Primary impacts, in the general plan process, could be added to the framework by county staff, while also creating and editing planning alternatives, refining the impacts associated with any policy option, and adjusting the values-based decision variables used to evaluate and compare alternatives. (Figure 2) The results of any changes to the policies or values were reflected automatically in various quality-of-life and alternative-trade-off indicators.
The results of these analyses were also exported as web pages with embedded tables and graphs, useful for updating online reports.
For Monterey County staff, the alternatives evaluation framework provided the ability to educate the public about issues that face the county at-large. Implications and trade-offs inherent in the planning policies were presented graphically, with the objective to reach consensus in a fraction of the time of more traditional approaches. Automated GIS Analysis Framework
Figure 4 shows the framework components and links. Policy choices were made by setting driver variables. Automatically, a suite of subsequent analyses produced the technical results, plus an evaluation of those results. Some of the analyses were spatial, and the resulting 2D and 3D maps were displayable, while others were rule-based and further analyze the spatial results. Base Data
Monterey County administration provided .shp format files with the GIS data used in this spatial decisions framework. Map layers included a DEM from a USGS raster, thus allowing perspective views. Polygons for slope classes were derived by the county, which corresponded to restrictions for building on high slopes. River buffers for the 50-, 100- and 200-year maximum flood boundaries provided another set of county building constraints, as did a map of active fault lines. Roads by class, vegetative cover, land-use and zoning boundaries, political boundaries, and planning areas were all used in the framework.
Subsequent to receiving the .shp files from the county, all GIS manipulations and analyses were performed using Cause&Effect, the same software that was used to build and deliver the framework. Initial analyses to set up the framework included intersecting the planning areas with the other map layers to provide summaries by planning area. (Figure 1) Primary Spatial Impacts
Some of the policy choices produced effects that were spatial. The effect of choosing a spatial policy acted in two ways in the Monterey framework. In the case where different land classes were affected by policies, various map themes were combined into a mask. For instance, different degrees of agricultural land protection were invoked by different choices for the agricultural policy buttons.
Environmental protection worked the same way, as different classes of vegetative land cover were designated for protection. The other case is where alternative maps were invoked by policy choices. The best examples are zoning maps created externally for different choices about the level of compact development. These map layers are still under development.
Environmental choices - in this case the extent of agricultural or habitat protection - were explicitly spatial and applied county-wide. Other policy choices were made and applied by planning area, and had indirect spatial effects through shifts in housing and population. Transportation policies that invoked new highways or rail corridors had both direct (land-use changes or loss of habitat) and indirect (attracting people and business) spatial effects. Secondary Spatial Impacts
An important objective of the framework was to show the distribution of housing development associated with population increases expected over the next 20 years. Where will new people and their housing go? Our approach breaks this question into three steps:
¥ Which areas are excluded from development?
¥ What planning-area information and policies attract people?
¥ What is the resulting relative attraction for every location in the county?
The answers look like the examples depicted in Figure 5.
We first determined the exclusion zones where housing could not be built under existing policies. These areas include flood plains, steep slopes, and existing land zoning. Additional exclusion zones that came from policy choices (agriculture and habitat) were merged with the pre-existing exclusions to create a final exclusion mask. Attractiveness is defined as proportional to the travel time from existing development. This attractiveness is modified according to the social and financial policies of planning areas. The result controls the allocation of people to planning areas and the housing that is required. Examples from two different policy choices and two different population projections are shown in Figure 5. City build-out limits were an important map layer, because this affects the population infill projections for cities, and subsequently the distribution of people and houses throughout the county. Discussion
There are millions of possible alternative plans even within the constrained choices. It is necessary to create and compare many alternatives in order to understand policy interactions, and to support a participatory public process. The ability to make these comparisons was seriously hampered by the need for manual GIS work, which proved expensive. Clearly the cost barrier has been overcome by automating the evaluation of spatial policies. The additional feature of working via the Internet opens vast possibilities for the public to become more involved in planning the future for the places they live. The Monterey County GPU alternatives evaluation framework proved that this vision is both realistic and practical. About the Author:
Scott Akenhead and Edward Gregr are consultants with Facet Decision Systems Inc., Vancouver, British Columbia, Canada. General inquiries may be directed via e-mail at [email protected]. Jared Ikeda, Annette Chaplin and James Colangelo are senior planners with the county of Monterey, Salinas, Calif. Inquiries may be directed via e-mail to Mr. Ikeda at [email protected]. Back |

