| Developing a Statewide Environmental Monitoring Program Using Land Satellite Information: The OhioView Example
By James Lein Introduction
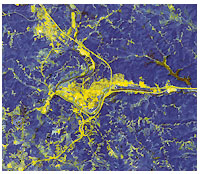 Landsat 7 image showing impervious surface for city of Athens, Ohio Landsat 7 image showing impervious surface for city of Athens, Ohio OhioView is a consortium of eight state universities in Ohio and an information technology infrastructure supported by cooperative agreements between the USGS EROS Data Center and the NASA Glen Research Center. Through OhioView, a satellite data acquisition system has been created that provides rapid and low-cost access to Landsat TM data for research and industry within the state. With this infrastructure in place, the opportunity exists to move the OhioView concept into an operational phase and also develop a focus on applications that will employ satellite data in critical decision support roles. The monitoring project discussed here is targeted at environmental decision support and the providing of satellite data to user groups who may otherwise be prevented from utilizing satellite data because of cost. This program has two main objectives, first to enhance the accessibility of environmental information to policy makers, and second to develop a geospatial data archive of critical landscape variables that can support statewide environmental planning and impact assessment activities. What is OhioView?
Recent initiatives by such government agencies as the USGS, NASA, and NOAA, as well as the rapid convergence of certain technologies, are driving a revolution in education, industry, and government second only to the advent of computers and the Internet. Terabytes of currently expensive commercial satellite data crucial to agriculture, civil engineering, education, disaster management, rural and urban planning, resource development, and environmental protection in Ohio will become available over the next four years at little or no cost to the average user. The challenge here is to capture, process, and organize these data and make them available to the citizens of Ohio in an easily usable and affordable manner.
OhioView was established to eliminate the financial and technological barriers to the use of remotely sensed satellite data in research, education, and public and private decision-making. The participating universities include Bowling Green State University, Kent State University, Miami University, Ohio State University (including two organizations, the School of Natural Resources and the Center for Mapping), Ohio University, University of Akron, University of Cincinnati, and University of Toledo.
It is anticipated that more colleges and universities, local governments, secondary schools, and private companies within Ohio will become members of OhioView as the use of remote sensing data grows within the state. Presently, OhioView has received two $3 million federal budget line items (for FY 1998 and 1999 respectively), and has been incorporated into the U.S. Geological Survey's base budget at a minimum of $1 million per year. Due to the operational success of this program, it is reasonable to expect that this figure will be increased to the full $3 million due to additional federal funding from Congress. These federal funds paid for a new satellite-data-receiving ground station at the Eros Data Center in South Dakota, and for high-speed computers to prepare the data for transmission, as well as ultra-high-speed data links to Ohio. Three federal grants paid for a modest proof-of-concept prototype research information distribution system for Ohio. This distribution system is now fully functional.
The continuing development of space satellites, and the capability of these satellites to monitor the Earth's surface, has changed the way that we observe and think about our environment. NASA, along with several other government agencies, has been charged with the task of developing a detailed understanding of the Earth and the processes that contribute to changes in our global climate. In response, NASA's Mission to Planet Earth (now Earth Science Enterprise) established the Earth Observing System (EOS), a fleet of satellites that will be launched over the next two decades. OhioView is designed to provide taxpayers with a significant return on their investment. How Does It Work?
The basic system architecture of the OhioView data infrastructure is as follows: The USGS EDC receives a Landsat 7 data stream and performs a Level One correction of the individual scenes. This data is then transmitted from the USGS server, using an OC3 network system capable of data transfer rates of up to 150 megabits per second. Utilizing the NASA Integrated Service Network (NISN), these Ohio scenes are sent to the OhioView server located at NASA Glen Research Center in Cleveland. From the NASA Glen facility, data are shipped using the NASA research and education network (NREN).
The corrected satellite data is then broadcast throughout the OhioView system in two complimentary ways: first, from the main server to slower and smaller systems at each consortium university that has been granted ftp permission to browse the main server and take specific scenes as needed. Alternatively, data are send to a main server installed at Ohio University, where it is placed into a temporary archive. Every 16 days, scenes in this archive are replaced in the repository, as well as in the central OhioView server at NASA Glen. Older scenes are archived and made available to future users of the data through the USGS CD-ROM production facility at Ohio University. From this data stream and archived data sources, timely satellite products are available to facilitate land-surface monitoring and environmental change detection. Defining a Need
An oft-cited study dating from 1984 documented the destruction of 4000 hectares of Florida wetlands over an 18-month period, all by projects granted by state and federal regulatory agencies that were ostensibly charged with protecting this wetland resource. The dramatic evidence brought forward in this report illustrates the complex issues surrounding land-use/land-cover change and the practical difficulties that must be addressed when attempting to assess cumulative environmental effects. When viewed individually, most land-use changes are rarely significant enough to warrant the attention of decision-makers. However, when such land-use trends are considered on a more synoptic scale, they frequently describe more substantial impacts. It is this gradual piecemeal degradation of natural resources that frustrates a clear understanding of environmental change, even though it is also the principal means by which change occurs, in particular, changes induced by human activity. These slow, gradual changes, interrupted geographically and subject to contrasting temporal rates and frequencies, impact the environment in a manner that often goes unnoticed until it is too late to provide a meaningful response.
To effectively manage environmental resources, land-use/land-cover data is needed at more synoptic scales to provide the wide-angle view that decision-makers currently lack. With information at this scale easily accessible to public officials and others involved in the land development process, the scenario described by the aforementioned 1984 study might not have occurred. Satellite data, such as Landsat TM, offers the only economically feasible and time-sensitive method to support such endeavors. Such information can also enhance efforts to develop better models and techniques for monitoring environmental alteration and the evolving methods designed to perform cumulative impact assessment, understand cumulative impacts, and track land-use changes.
The OhioView monitoring project represents the first step toward these larger goals. It begins by providing the information needed to facilitate the synoptic-scale characterization of land-use/land-cover features, creating a baseline against which future changes can be detected. From this beginning, the project facilitates the following programs:
• Establishment of ongoing monitoring targeted toward critical land-use/land-cover categories
• Development of land-use/land-cover support capabilities that utilize satellite data products as input to the scenario-based assessment of alternative public policies
• Eventual implementation of a web-based decision support system that will enable ready access to land-use data and models by public and private decision-makers in Ohio.
Above all, the project serves to demonstrate the applied value of the OhioView program and provide a model for implementing a statewide monitoring and analysis program linking universities, industry and government in the applied use of remote sensing technology. This applied aspect of the project greatly expands the role of remote sensing data in public policy making, and points to the future integration of information technologies (IT) to guide resource assessment, planning, and policy analysis. The Monitoring Problem
Monitoring describes an intermittent (regular or irregular) surveillance carried out in order to ascertain the extent of compliance, with a predetermined standard or degree of deviation from an expected norm. In this era of heightened awareness of environmental change, monitoring takes on a critical role in maintaining environmental quality. From an environmental perspective, the aim of monitoring is to detect changes and trends in critical indicators so that decision-makers may respond appropriately and avoid the adverse consequences of unanticipated effects.
Within this context, monitoring provides important early warning information and offers the potential for documenting processes of environmental change, predicting future changes, and controlling the timing, location and degree of such change. Supplied with early warning information, decision-makers can adjust policies and coordinate activities better to avoid unwanted effects. Thus the reasons for instituting a monitoring program generally fall into three categories. These include assessing the effectiveness of policy or legislation, regulatory monitoring for purposes of compliance, and detecting incipient (undesirable) change.
Although these activities are not mutually exclusive, they suggest important benefits that can be derived from monitoring.
From the outset of the Landsat program, monitoring was hailed as a significant rationale for deploying Earth-resource satellites. Monitoring has been an active topic in remote sensing with satellite-based programs developed for drought and desertification analysis, deforestation assessment, agricultural studies, and urban growth analysis. As a vital application of remote sensing, monitoring supports several critical needs:
• Derive and apply biophysical or geophysical environmental parameters from remote sensing data at various spatial scales
• Develop and demonstrate procedures for using remote sensing data in detecting, identifying and quantifying environmental change
• Contribute to the development of technologies for using remote sensing data to support public and private decision- making.
Although monitoring has been used as a major justification for supporting and funding satellite data acquisition systems, an operational monitoring program at the scale proposed here has not yet been implemented. However, with the facilities in place following the successful installation of OhioView, the technological infrastructure and expertise is in place to achieve this objective. The reduced cost and simplified access to remotely sensed data as afforded by OhioView provides a means for promoting the increased routine use of Earth observation data in an operational setting. As a result, this project provides the first step toward linking these resources to the monitoring and management of environmental change. Project Features and Design
The OhioView statewide monitoring program has been designed with six interrelated objectives in mind. These include:
1. Develop baseline land-use/land-cover inventory data to supplement existing sources and augment them by targeting critical public policy issues, such as agricultural land conversion, urban development, forest resources, vegetation dynamics, and environmentally sensitive areas
2. Provide annual snapshots of selected land-use/land-cover attributes and document important statewide trends
3. Deliver inventory data and annual updates onto a web-based server dedicated to the users across the state, including public officials, private citizens, K-12 students, and university researchers
4. Install all derivative map products onto the statewide geospatial data-clearing house
5. Test new techniques and emerging methodologies for improved image classification, and change detection procedures that employ artificial neural networks, fuzzy logic classifiers, hybrid change detection algorithms, and GIS integration
6. Develop modeling tools that can use satellite data products to simulate future land-use changes, and examine the potential for providing web-based decision-support systems.
The monitoring program has a three-phase structure. These phases are designed in complimentary fashion to build on and enhance the information base created from EOS sources. With reference to land-use/land-cover mapping in Ohio, this three-phase plan will provide tools to utilize remotely sensed information in support of regional planning efforts, and also expand the potential application of this data resource by linking OhioView with user groups throughout the state. Although the research will be spread among the OhioView universities based on demonstrated expertise that is outlined in the following sections, coordination of this project will become the responsibility of an OhioView research group made up of working partners in the project.
OhioView research universities have been gathered into specialized groups to initiate topic-specific thematic mapping and image analysis. These include:
1. Vegetation Dynamics Group - Cincinnati, Toledo, Ohio Univ.
2. Land-Use/Land-Cover Analysis Group - Kent State, Akron, Ohio Univ.
3. Environmental Hazard Group - Bowling Green, Miami, Ohio State. Phase I - Monitoring and Mapping
The research focus of Phase I involves evaluating the development and use of artificial neural networks, and the integration of Landsat with the NOAA AVHRR (and later, the MODIS platform) to provide a two-tiered, multi-scale information base for statewide land-cover mapping. Differing scales of investigation targeted at specific land-use and environmental issues need to be developed that can be resolved effectively using appropriate sensor-spatial/spectral resolution capabilities.
The AVHRR system will be used initially to produce coarse-resolution data of large-scale land-cover processes, directed primarily at vegetation dynamics and bioclimate analysis. Landsat TM data will be applied to study urban processes and develop baseline data for continuous land-use change detection. MODIS will replace the AVHRR system following the launch of the AM-1 satellite. Neural network research will concentrate on the potential of these systems to function as intelligent classifiers, and furthermore will be applied in hybrid methodologies to map specific land-use/land-cover features. The demonstrated success of these models suggests that they may offer time and cost savings when applied to long-sequence image analysis and mapping, and may provide beneficial results when used in a monitoring program. Phase II - Modeling and Image Integration
The snapshot images of Ohio developed during Phase I will give public officials, private citizens, and educators current data on the land-use/land-cover trends across the state. Trend data analyzed sequentially is a useful way to identify patterns and explain the status of progressive land-surface processes. Trend data, however, has another valuable application as input to predictive models. Research in Phase II will explore the application of remotely sensed data, and also the thematic maps produced via image classification in land-use/land-cover simulations and risk assessment studies. As a result, Phase II will concentrate on developing models of urban process that utilize satellite data as input, presenting these models in a decision support environment. These models will allow those public officials and private citizens using OhioView to evaluate development scenarios and experiment with alternative development strategies in order to create more sustainable urban systems. Phase III - Deployment of Web-based Decision Support Capabilities
Data and models are useful in the analysis and assessment of environmental processes, but requires a mechanism to facilitate access to these models and guide their use in decision support systems. Phase III of the project examines the technologies that are available to provide decision support capabilities and export them to the World Wide Web. This will give Internet access to specialized models for simulating land-use/land-cover changes. This research will build on emerging web-based geographic information systems to design more specialized decision support systems. Decision support research will initially concentrate on the two dominant land-use trends in Ohio: urban sprawl and agricultural land preservation. Other simulation modules capturing critical land-use and environmental processes may be added at a later date. Conclusions
Remotely sensed satellite data has revolutionized the way in which the study of the land surface is conducted, including the environmental fields of geography and geology, mapping, and urban planning. Remotely sensed data offers a perspective on the landscape that is not possible with ground-based systems. Beginning in the early 1970s, NASA has maintained a fleet of satellites that monitor the Earth's surface, including the Landsat series. The launching of two new satellites - Landsat-7 and Terra-1 - adds to the amount of data available for analysis. Unfortunately, this huge database has been greatly under-utilized because of the overwhelming cost of satellite data. The OhioView Consortium has been developed to reduce the price of satellite data to universities in Ohio, and to provide research and application gateways to user communities within the state. About the Author:
James K. Lein is a member of the geography department at Ohio University, Athens, Ohio. He may be reached via e-mail at [email protected]. Back |

