| Case Study of Using IKONOS Imagery in Small Municipalities
By Felix McCarthy, Dr. Philip Cheng and Dr. Thierry Toutin Throughout the 1990s and on into the 21st century, fiscal restraint and downsizing has filtered into provincial and municipal governments as constituents demand greater accountability from their elected officials. These representatives are called upon to spend tax dollars wisely. Governments are required to do more with less: more work with fewer resources. Located at the bottom of the resource feeding chain, small municipalities are left with few dollars to spend on the gathering and maintenance of spatial data. This article examines the feasibility of the use of high-resolution satellite imagery by small municipalities.
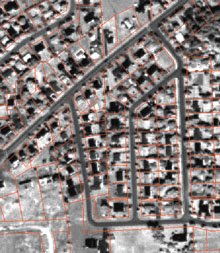 Figure 1: One-meter orthorectified IKONOS panchromatic data overlaid with 1:1000-scale vectors. Figure 1: One-meter orthorectified IKONOS panchromatic data overlaid with 1:1000-scale vectors. Space Imaging's IKONOS GEO product was chosen because it offered the highest possible resolution in commercially available satellite data at the time this project was begun (summer 2000). Another reason for this selection is that the OrthoEngine IKONOS module by PCI Geomatics can accurately orthorectify IKONOS imagery. The city of Fredericton (New Brunswick, Canada) supplied the imagery, and PCI Geomatics supplied the software. This project was undertaken as part of the Masters in engineering program work performed by this article's first-named author (Mr. McCarthy) at the University of New Brunswick's Department of Geodesy and Geomatics.
The city of Fredericton is located in southwestern New Brunswick, about a one-hour drive inland from the Bay of Fundy, and perhaps an hour from the U.S. border. The population of Fredericton is in the neighborhood of 46,000. The city is nestled in the St. John River valley and covers an area of 138.29 square kilometers.
It was decided that both four-meter multispectral data and one-meter panchromatic data would be used in the project. The city of Fredericton entered into an educational data-sharing agreement with the University of New Brunswick's Geodesy and Geomatics Department and supplied the IKONOS data. The four-meter multispectral product was ordered so that the university could experiment with change detection, fusing the multispectral data with the panchromatic data.
In the first week of July 2000, an order was placed with a local reseller of Space Imaging's data. The request was for the panchromatic and multispectral GEO product, 90 percent cloud-free, covering an area of approximately 315 square kilometers. Because the city's boundary lines are irregularly shaped, an extra area had to be collected in order to capture the entire city. This data was collected in the last week of July and delivered shortly thereafter. Collection periods for cloud-free data have smaller windows of opportunity and can therefore take longer to collect. The data was delivered with virtually no cloud cover, and local representatives were very pleased with the quality of the images they received.
The data was delivered in two separate scenes: divided into eastern and western halves but on three separate CD-ROMs. The scene for eastern Fredericton was delivered on two CDs because the total file size was larger than one CD could hold. Western Fredericton was collected as a separate scene because the total scene area was larger than what the IKONOS sensor could pick up. OrthoEngine was used to join the split image of eastern Fredericton back together. The city of Fredericton ended up with two complete scenes composed of Fredericton East (approximately 225 square kilometers) and Fredericton West (approximately 136 square kilometers).
The multispectral and panchromatic GEO products cost the city of Fredericton approximately $14,000 after taxes. [Ed. Note: All prices quoted herein are in Canadian dollars] The IKONOS imagery for Fredericton was less than half the cost of the city's aerial photography. In 1995, the city paid approximately $35,000 to photograph the city at 1:5000, including fees for developing. The aerial photography was scanned to a 20cm pixel and required processing and orthorectification in order to create a digital orthophoto product. A total of 110 images (of approximately 1.2 square kilometers each) were required to cover the populated areas of the city, leaving about one third of the city with no digital coverage. These were forested areas. No single staff member was dedicated solely to orthorectifying aerial digital photographs. The project was worked on whenever staff was available and time permitted. As a result, it took about a year for the city to collect ground control points (GCPs) and process these 110 images. If one takes into account the staff time and limited processing resources, it is estimated that the real cost of the digital orthophotos fell into the $70,000 range. Satellite Geometric Model and Software
PCI OrthoEngine software was used for ortho-image generation. This software package supports reading of the data, GCP collection, geometric modeling, digital elevation model (DEM) generation and editing, orthorectification, and either manual or automatic mosaicking. The geometric model used inside the software is a rigorous (parametric) model developed by one of the listed authors at the Canada Centre for Remote Sensing (CCRS), Natural Resources Canada. This model is based upon principles relating to orbitography, photogrammetry, geodesy, and cartography. It reflects the physical reality of the complete viewing geometry and corrects distortions that occur in the imaging process due to the platform, sensor, Earth, and cartographic projections. The model has been successfully applied using only a few GCPs (from three to six) to VIR data (Landsat, SPOT, IRS, MOS, KOMPSAT, and IKONOS), and also to SAR data (ERS, JERS, SIR-C, and RADARSAT). Based upon good quality GCPs, the accuracy of this model was proven to be within one-third of a pixel for medium resolution VIR images, and within one resolution cell for SAR images.
Because most IKONOS images are acquired at off-nadir viewing, the accuracy of GCPs should be less than one meter and the DEM should be within a five-meter accuracy range. Sub-pixel accuracy (which may be obtained with satellites such as SPOT and Landsat) will not be achievable for IKONOS, even for flat terrain. To date, the IKONOS module has been successfully used in various projects in a number of countries. Ground Controls and DEM
New Brunswick has a provincial mapping body known as Service New Brunswick. Among its many responsibilities is the digital mapping of the entire province. One of their products includes a 1:10,000 digital topographic database, which includes Digital Terrain Models (DTMs). The province collected these DTMs in the late 1980s from 1:35,000 aerial photographs. The DTMs were collected using photogrammetry as a series of profiles spaced 70 meters apart. The DTM for Fredericton was enhanced with 3D data collected for various capital projects around the city. Twelve 1:10,000 digital topographic database maps were required to cover the scene. The digital maps cost $25 each for a total of $300, an inexpensive way to obtain DTMs. The OrthoEngine module was used to create the DEM of the entire city. Spot heights were imported into OrthoEngine's Import & Build DEM module from AutoCad DXF files. From here, the DEM from the Vector/Points program was used to create the DEM that OrthoEngine would ultimately use for the orthorectification process.
GCPs were collected using a Leica GS-50 GPS unit. With the aid of Coast Guard beacons, a GPS unit will give average positional accuracy of around 30cm. Considering that panchromatic pixel spacing is one meter, the control points collected using the GPS unit were more than adequate for this project. OrthoEngine's GCP/TP processing step was used to enter the control points.
It took about four days to pick up the GCPs necessary to rectify the panchromatic images. In rural areas, fence corners and paved driveways were found to be good sources of control. Paved driveways make a very visible corner where they meet the street, and are often a different shade when compared to the adjacent roadway. Another good source of control in rural areas was Canada Post multiple-dwelling mailboxes. In many instances these are placed on a concrete pad, which is often quite visible in the imagery. In urban areas some of the best control points tend to be sidewalk intersections, corners of tennis courts, fences around playing fields, swimming pools, and wherever asphalt driveways cross concrete sidewalks. Panchromatic Results
Orthorectification was achieved using the OrthoEngine IKONOS module. For each project the output projection was set to local meter, and the Earth Model was set to D-04 (Nad83 - Canada Ntv1). This setting closely matched the ellipsoid used for the city's existing GIS data and digital orthophoto package. The Ortho Generation process was surprisingly fast and appears to have been fairly accurate as well. Fourteen GCPs were used for Fredericton East. The RMS residual for these control points was 2.53 meters (X-RMS 2.40m, Y-RMS 0.83m). The maximum residual was 3.48 meters on the X-axis and 1.39 meters on the Y-axis. The image was then orthorectified with DEM pixel spacing of four meters, covering the entire study area and using the Cubic Convolution option. Twelve GCPs were used for Fredericton West. The RMS residual for these control points was 2.03 meters (X-RMS 1.59m, Y-RMS 1.27m). The maximum residual was 3.34 meters on the X-axis and 1.90 meters on the Y-axis. This image was also orthorectified with the same DEM used for Fredericton East, employing the Cubic Convolution option. Both image results demonstrate consistencies in the orthorectification method and software.
To check the accuracy of the orthorectified images, the GPS unit was used to collect independent checkpoints (ICPs). These points were distributed over the entire image and not collected near control points. Eighteen ICPs were collected for Fredericton East. The average X-difference was 2.55 meters and the average Y-difference was 0.86 meters. Out of these 18 ICPs only one X value was greater than four meters, and all Y values were less than two meters. The ICP with an X value greater than four meters was collected in a part of the image where there was a steep slope. The X values were within four meters 95.4 percent of the time, and the Y values were within two meters 100 percent of the time. This analysis therefore demonstrates that the system is robust and consistent for the whole image without generating local error.
To check its accuracy, 14 ICPs were collected for Fredericton West. The average X-difference was 1.845 meters and the average Y-difference was 0.900 meters. The overall results were the same as those for Fredericton East. Only one X value was greater than four meters and all Y values were less than two meters. The X values were within four meters 91.7 percent of the time and the Y values were within two meters 100 percent of the time. The values for the orthorectified images fall within the accuracy rating of Space Imaging's precision product, which is four meters CE90. This simply means that any point on the image will be within four meters of its true position 90 percent of the time.
Once the two images were orthorectified, it became a simple process to move the image data from PCI's pix format to a format that the city's GIS could use (CARIS ipv files). PCI Geomatica was employed to apply any enhancements to the image (brightness, contrast and sharpness adjustments) and then export the enhanced image to a geo-TIFF file. The two images were imported into the city's GIS so that a qualitative check could be performed. The images were overlaid with the property fabric and the street centerline network, and visual checks were made. These qualitative results confirmed the quantitative accuracy assessed over ICPs (four meters CE90). Multispectral Results
Once the accuracy of the one-meter panchromatic image was established, it was used for GCPs with the four-meter multispectral image. Because features in the image have a four-meter pixel, they are less defined than in the one-meter image. Therefore, sidewalk intersections and driveway/street intersections tended to be good sources of control points.
The multispectral imagery was delivered in two scenes: Fredericton East-MS and Fredericton West-MS. Twenty-four GCPs were used for Fredericton East-MS. The RMS residual for the control points was 1.35 meters (X-RMS 0.70m, Y-RMS 1.15m). The maximum residual was 1.66 meters on the X-axis and 2.12 meters on the Y-axis. The image was then orthorectified using the same DEM as was used for the panchromatic images and by employing the Cubic Convolution option. Nineteen GCPs were used for Fredericton West-MS. The RMS residual for the control points was 2.33 meters (X-RMS 1.52m, Y-RMS 1.76m). The maximum residual was 3.18 meters on the X-axis and 3.32 meters on the Y-axis. This image was also orthorectified with the same DEM as the one used for Fredericton East-MS, also employing the Cubic Convolution option. Both image results demonstrate consistencies in the orthorectification method and in the software.
Independent checkpoints (ICPs) were used to check the accuracy of the orthorectified images. These points were distributed over the entire image and not collected near control points. Twenty ICPs were collected for Fredericton East-MS. The average X-difference was 1.88 meters and the average Y-difference was 1.12 meters. Out of the 20 ICPs, the maximum X value was 3.80 meters and the maximum Y value was 2.65 meters. The X values for the ICPs were within half a pixel (less than two meters) 60 percent of the time and within one pixel (less than four meters) 100 percent of the time. The Y values were within half a pixel of their true location 90 percent of the time and within one pixel 100 percent of the time.
Twenty ICPs were also collected for Fredericton West-MS. The average X-difference was 1.85 meters and the average Y-difference was 1.80 meters. Out of the 20 ICPs, the maximum X value was 4.08 meters and the maximum Y value was 3.82 meters. The X values for the ICPs were within half a pixel (less than two meters) 60 percent of the time and within one pixel (less than four meters) 95 percent of the time. The Y values were within half a pixel of their true location 50 percent of the time and within one pixel 100 percent of the time.
An additional qualitative check was made on the accuracy of the orthorectified images by importing them into the city's GIS and overlaying road vector centerlines on top of the images. A visual check of the images revealed that the orthorectification process was acceptable. Conclusions
In the final analysis, it is quite feasible and practical for small municipalities to collect and use high-resolution satellite imagery such as that offered by Space Imaging. The total cost of using IKONOS imagery for the city of Fredericton fell into the range of $20,000 to $25,000. These costs included the collection of both panchromatic and multispectral scenes that covered the entire city. Also included in this estimate was the staff time necessary to collect control points and orthorectify the images.
Although the IKONOS images appear fairly inexpensive when compared to digital orthophotographs, there are some tradeoffs to consider. The most important of these would be resolution and true color. Changes in technology, particularly in digital photography and GPS, could likely remove some of the processes involved in the orthorectification of aerial photography. In this event there would be no scanning of photos and GPS would aid in registering the image, which means that flying the city today would be significantly cheaper than in the past. It is estimated that the scenes of the city of Fredericton could be processed and orthorectified in three to four weeks.
Although the IKONOS one-meter product could not replace the city's 20-centimeter digital orthophoto product, it proved to be a great addition to the city's image database. This imagery is used for many purposes, including as a backdrop in the city's corporate Web GIS, for detecting changes in the city since the aerial photos were flown, and to get an overall picture of what is happing around the city's boundaries. Beginning in 2002, the city of Fredericton is looking to update its aerial photos every five years. High-resolution satellite imagery could be collected for years that no aerial photography is flown. As time progresses, satellites will provide even higher resolution images of the Earth. The cost of sub-meter satellite imagery will become even less expensive in the future as competition increases. About the Authors:
Felix McCarthy works full time as a GIS analyst for the city of Fredericton and is completing his Master's degree in engineering (GIS Specialization). He can be reached via e-mail at [email protected].
Dr. Philip Cheng is a senior scientist at PCI Geomatics, Richmond Hill, Ontario, Canada. He can be reached via e-mail at [email protected].
Dr. Thierry Toutin is a principal research scientist at the Canada Centre for Remote Sensing (Natural Resources Canada), Ottawa, Ontario, Canada. He can be reached via e-mail at [email protected] . Back |

