| LIDAR Processing: It's Not Black Magic
By Robert A. Fowler This is an oblique view of a point cloud of LIDAR points. The red portion of the image shows ground points, and the green portion of the image shows the vegetation (tree canopy) points. Software can usually define the difference through nearest-neighbor comparisons. 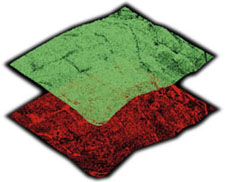 A reader recently wrote: "My name is Bill Johnson. I read your last article in EOM. I have come close to using LIDAR in the past, but can't get past a couple of "mind hurdles." I figure now is as good a time as any to ask some questions. A reader recently wrote: "My name is Bill Johnson. I read your last article in EOM. I have come close to using LIDAR in the past, but can't get past a couple of "mind hurdles." I figure now is as good a time as any to ask some questions.
First of all, I realize you can get points every ten feet, but what about curb lines, bridges, and major breaks? I do not see how these can be accounted for without a definitive break-line. Without them, how can you accurately show contours in those areas?
Second, with the massive amount of points that come back, how do you determine which ones are good and which ones need to be thrown out? Doesn't the laser bounce off anything in its path, such as birds, leaves, or even raindrops? Additionally, if you fly [over] a heavily urbanized area, I would think the process of editing these points would drive you crazy. How much is involved in removing points from mailboxes, fire hydrants, poles, automobiles, and so on?"
My replies to your questions, Bill, which are good ones that LIDAR operators get asked all the time, form the basis of my article this month.
You are absolutely correct; LIDARs do not collect break-lines. Depending upon the density of points, this can be a problem if break-lines are truly what you want. Most LIDAR systems today are set up to work over land by using an infrared beam. Exceptions include hydrographic LIDARs that use a different part of the color spectrum. Infrared beams tend to be absorbed by water, showing either very weak returns or none at all when hitting the water. Over bodies of water there is something we call a "data void." As these areas are usually fairly obvious to a processing technician, a "fence" can be put around the lake or the river. In this manner, subsequent processing of contours will not go through the lake.
However, this is about the extent of easy break-line interpretation with LIDAR data. However, LIDAR is a different technology, so let's take a step back and look at it from a different perspective. I always ask people what they do with contours. After all, these are only a visual aid, and almost no one uses them for much of anything. Engineers generally convert them to a Digital Terrain Model (DTM), which is what a LIDAR image gives you directly. LIDAR provides a density of points that gives most engineers far more information than they normally require.
Having said that, because LIDAR is a machine that captures data at a specific time interval - in our case, something like 5000 times per second - the collection of data points is somewhat random. By this I mean that the system will not necessarily collect points exactly where you want them all the time. For example, we cannot guarantee that LIDAR collecting data along a road corridor will necessarily hit the bottom of a ditch next to the road. It might hit bottom, or it might hit the side of the ditch. If it's a very narrow ditch, it could miss it entirely. As the system scans from side to side, on the way back it might simply hit the bottom of the ditch on the next pass, but then again, not necessarily.
If you are a client, how will you know if there's a ditch? The short answer is, without supplementary data such as imagery, you won't. This is therefore an argument for additional standard air photo, digital image acquisition captured at the same time as the LIDAR data, or for LIDAR intensity data, although the latter is not necessarily a good answer for the aforementioned problem. This is because LIDAR intensity data are the result of the strength of the return signal. When the signal hits materials of different reflectivity, the intensity feature records that difference. If there is water at the bottom of the ditch, it shows different signal strength than does the surrounding grass. However, if the ditch is dry and grass is uniformly present in the ditch, the intensity will be uniform as well, and the ditch will not be obvious.
The newest versions of LIDAR equipment collect data many more times per second. For example, the next announced system is expected to collect 50,000 points per second. Depending upon flying height and speed, at these rates of kHz you will get data points very close together, and the chances of missing a ditch are considerably reduced. The downside to these systems - and isn't there always at least one? - is that the data files are so large we literally experience data overkill. Very few clients have computer systems capable of handling these huge files. This means that the LIDAR operator has to decimate the files. Right now there is a dearth of intelligent software that will know the areas where important features (such as narrow ditches) need to be kept, compared to the areas where the terrain is more regular and can be decimated with no real loss of information. Rest assured, software that will do this intelligently is on the horizon.
If all this sounds somewhat negative, it's really not all that bad. Even at 5000 points a second there is a wealth of data collected and, with digital imagery taken at the same time as the LIDAR survey, you can have the best of both worlds. Many clients are developers or engineers who have to move dirt, and they need to know volume. On average, LIDAR does a better job of providing base data than does any other technology, especially in vegetated areas. It's also faster. If a project has a short time frame, LIDAR is the quickest way for getting data to a client.
Finally, if you want to visualize LIDAR data without having contours, there are a number of software packages that allow you to make a shaded relief from point data. This can be as effective as contours, if not more so.
The second part of your question is very simple. I don't actually do much LIDAR analysis myself, so it doesn't drive me crazy at all! Of course, our technicians who work with the data might not agree with me. But seriously: yes, the LIDAR will receive information from whatever it hits. If it does reflect off a bird, then that's what you get. However, it is unlikely to reflect off raindrops. Because LIDARs don't work very well in rain, snow, thick smoke, or in very thick haze or clouds, they don't get flown under these conditions. But you are correct in asserting that the beam can bounce back from mailboxes, fire hydrants, or even moving vehicles. There has even been the odd occasion where we've hit the top of a flagpole.
There are a couple of things that will help you in this regard. First among them is the beam width. This measurement can vary by the type of laser and the system. Although lasers generate a very narrow coherent beam, the beam does distend over distance. As a result, a beam that is a micron or so wide at its source can be anywhere from six inches to three feet wide by the time it gets close to the ground. As you can imagine, even at six inches wide it is possible for the beam to hit a variety of things in succession. It could hit a small branch, several leaves, and then part of a corner of a building, continuing down to the ground. Most systems allow the operator to select what he wants to record. This could include the first reflection, the last reflection, or both. On some equipment, up to five different reflections from a single pulse can be collected. Depending upon the client's needs and the use of the data, these choices will vary.
However, as we are often dealing with gigabytes of recorded information, most clients decide that the last pulse is quite sufficient. This is the one most likely (but not always) to be the most useful, as it usually indicates a solid object such as a building or the ground.
But, you are probably thinking, doesn't the width of the beam have some effect on accuracy? Yes it does, although this is arguable. Wider beam systems do tend to average a little bit more, with some loss of accuracy. On the other hand, most of the returned energy tends to be from the center of the beam, and there is a fall-off toward the perimeter. But it should be noted that operators of these wide-beam systems usually fly very broad-area projects where the highest possible accuracy level is not vital.
Actually, most of the problems you mention can be solved through software. Each LIDAR comes with software that processes the complete data set to remove irrelevant data. If you have a proprietary system, software is generally written for it. How does it do this? While the workings of each package are carefully protected, the answer involves making numerous comparisons among all of the adjacent points.
To put this in terms that are easier to understand, imagine what actually happens during the process. Data are collected from everything the LIDAR hits: the ground, buildings, trees, lamp standards, and so on. Now, picture all of these data points in a 3D model, floating in space in the form of little dots of light. In fact there are many software packages that allow you to do exactly this. When the 3D model is rotated and viewed from different angles, it soon becomes obvious that a large number of the dots are on a "lowest plane," and the remainder appear to float above it.
Because there are hundreds of thousands of data points, the processing software assumes that the lowest level of points within the data set are ground. It then assumes, quite logically, that all of the stuff floating above the ground must be something else. When the floating dots are in a regular configuration, it is also quite obvious these represent a building, a bridge, or some other sort of cultural feature. When these dots appear irregular and sort of lumpy, they obviously represent trees or vegetation. I know this all sounds kind of hokey, but it actually works. When you look at a LIDAR file with this sort of visualization software, you can really see it happen.
But, you may ask, how do we know that the lowest apparent point is the ground and not a lump of grass or an old cardboard box that someone threw away?
The answer to that is, we don't, certainly no more than a photogrammetrist who looks at a lump of grass would know that he's seeing grass or a lump of dirt. But if the box is under a tree and the LIDAR misses the foliage and gets a return, it's still closer to the right results than is the photogrammetrist's "guess" of the ground. I should know, as I've spent more than a few years peering through binoculars into stereo plotters.
The LIDAR software has sophisticated algorithms that perform a great many comparisons between points to determine, more or less automatically, which is the ground, which is a building, and which is most likely to be vegetation. Then there are the odd outlying points, such as the single spot on a flagpole, a light standard or a bird. These are assumed to be exactly those - so-called outlyers that are usually discarded. When in doubt, the software tends to remove single data points that appear above the ground. As a result, mailboxes, fire hydrants and flagpoles are consequently removed.
As a quality-control mechanism, Lasermap, like so many others, operates its LIDAR with a GPS-tagged video or digital frame camera. In actual fact, the processing technician can scroll through the tape or photo record and view what was beneath the LIDAR at any one point. This determination can usually help sort out problems where interpretation is not as obvious as using the data file alone.
These answers come down to so much data being collected, and semi-intelligent processing algorithms making assumptions that are right perhaps 95 percent of the time. With the proper analysis and interpretation by the processing technician, this rate can range between 98 and 99.9 percent. But if the LIDAR happens to hit a large rock partially hidden by a tree, it will probably be accidentally removed, and that would be the wrong thing to do.
However, let's be fair. No technology is without its limitations. Even interpretation in photogrammetry is subject to individual experience and intuition. And if that rock really was under the tree, the photogrammetrist wouldn't have seen it, either. About the Author:
Robert Fowler is a regular contributor to EOM. He is vice president of sales and marketing for Lasermap Image Plus/GPR. He may be reached via e-mail at [email protected]. Back |

