
|
 |
|
Using
the High-Spatial-Resolution HyperSpecTIR Imaging Spectrometer for Geologic
Applications Abstract The HyperSpecTIR imaging spectrometer, developed and built by Spectral Technology & Innovative Research Corporation (SpecTIR), is ideally suited for geologic as well as a multitude of other applications. High spatial resolution (from one-half to five meters in normal configuration), combined with high spectral resolution (standard 227 bands with ~8-12 nanometer bandwidths) across the full reflective spectral range (450-2450nm), open many opportunities for observing spectral phenomena on a scale not yet seen. The integrated beam-steering optics allow data to be collected at low altitudes (500m) without incurring additional expense for custom mounting onto stationary or slow-moving platforms such as helicopters. Introduction The past few decades have seen a movement from hyperspectral instruments that produce noisy data within a few dozen channels to newer instruments, such as AVIRIS, that produce data with high signal-to-noise ratios over several hundred channels. With the successful launch of Hyperion on 21 May 2000, hyperspectral remote sensing has now gone orbital. However, the hyperspectral industry remains largely an airborne one, with the high requirements for signal-to-noise ratios remaining problematic for orbital sensors, at least for now. Although there are major opportunities for research, the use of hyperspectral data for practical applications has become commonplace. A variety of sensors are available to the commercial marketplace and government agencies, each tailored to specific applications based upon spectral range, spectral bandwidth, spatial resolution, cost, and a host of other factors. HyperSpecTIR (HST), one of the newest imaging spectrometers available, is well suited for a broad range of applications. It has shown itself to be especially useful in geologic applications – classic hyperspectral usage – as well as for vegetation and environmental purposes.
Sensor and Data Description The HyperSpecTIR instrument is a full-range (450-2450nm) imaging spectrometer, designed specifically to collect high-spatial resolution data (three meters or less) without compromising its signal-to-noise ratio. Table 1 lists the specifications for this sensor. The HST utilizes a two-dimensional sensor array consisting of 256 spatial pixels and 240 (227 unique) spectral pixels. This array is scanned in a whisk broom fashion, resulting in scan lines of 256 pixels down-track and anywhere from 100 to 1000 pixels cross-track, depending upon the desired swath width. Swath width is a function of altitude, aircraft speed, and desired integration time. With a one-milliradian, instantaneous field of view (IFOV), each kilometer of altitude above ground level (AGL) equates to a meter of ground sampling distance (GSD). Nominal data collection in standard aircraft is at three kilometers AGL flying at 130 knots, resulting in three-meter pixels and a swath width of approximately 2.1 kilometers. A unique beam-steering optics image stabilization system, designed by SpecTIR, allows for real-time correction of aircraft motion deviations in the pitch, roll and yaw axes, even in heavy turbulence. This stabilization system represents a third-generation advancement over early tactical airborne systems developed at SpecTIR. The effectiveness of this stabilization system is illustrated in Figure 1, where the same area was flown twice: once with the system on, and once with the system off. One advantage of this system is its ability to use standard mounting on fixed-wing aircraft operated at low altitudes – where turbulence is often a factor – in order to obtain data with GSDs as small as half a meter. GPS data are recorded during image collection, and the nadir pixel of each swath is tagged with the appropriate coordinate. The swaths may then be resampled to a common geographic base and used in a GIS. The HST is presently flown aboard a Cessna 310 aircraft, and the mounting is easily customizable for numerous other platforms. Data are collected in 227 contiguous spectral bands across the full visible/near infrared (VNIR) and shortwave infrared (SWIR) ranges. Spectral sampling and bandwidths are approximately 10nm to 12nm in the VNIR, and 8nm to 10nm in the SWIR. These bandwidths are measured at full-width half-max (FWHM) of the spectral response curve. For further spectral detail, the first 45 VNIR channels (corresponding to 450nm to 965nm) may be sampled twice as often, resulting in 90 channels with approximately 5nm to 6nm bandwidths. This capability is especially useful for vegetation applications where highly detailed measurements of the chlorophyll red-edge and other biochemical absorption features are desired. In addition to the 5nm to 6nm bandwidth coverage, the 8nm to 10nm NIR/SWIR coverage provides canopy chemistry and foliar water status data important in agricultural and environmental studies. SpecTIR has developed software to generate radiance and reflectance cubes in a highly automated environment. It is not uncommon to have completely processed radiance cubes for all the data collected during a flight an hour or so after landing, and reflectance data a short while later. Combined with the beam-steering optics stabilization, this allows for the potential of preliminary analysis while still in the field. Radiometric corrections make use of onboard bright and dark sources in conjunction with laboratory measured spectral calibrations for each detector element. The radiance data is converted to reflectance through the use of software written at SpecTIR. This software uses MODTRAN4 atmospheric modeling, where each detector element is corrected independently of the others with its own spectral calibration. The radiometrically and atmospherically corrected data are then ready for value-added processing, such as that described in the following section. These images may be georectified at any time by using the internal geometry models (IGM) and geographic lookup tables (GLT) provided with the data. Because the sensor makes real-time corrections for aircraft motion, georectification consists only of removal of look-angle geometry effects (the so-called ‘bowtie effect’), rotation to account for aircraft heading and magnetic declination, and placement into the desired map projection. Mineralogic Mapping This article focuses on data collected over Cuprite, Nev., on 30 June 2002, for the purpose of evaluating HyperSpecTIR’s mineralogic mapping capabilities. The Cuprite mining district, located in the southwestern part of the state – about 30 kilometers south of Tonopah – is well known for its extensive alteration mineral assemblages. For this reason and due to the scarcity of vegetation, this region is a popular choice for the evaluation of new sensors. Data were collected primarily with a three-meter GSD, with some one-meter GSD flight lines over specific targets of interest. Evaluation of these data, as well as data collected elsewhere for multiple application evaluations (littoral environments, agricultural assessments, hydrocarbon seep detection, natural vegetation response to geobotancial stress and air pollutants, etc.), is ongoing by EarthSat and other investigators. This material will be published separately. Figure 2 shows several of the swaths within a flight line, concatenated for spectral analysis. Plane motion was from the bottom of the page towards the top, with the instrument scanning from left to right. Each scan produces an individual hypercube with dimensions of N samples times 256 lines times 227 bands, where N depends upon the swath width. In this case, swaths were 549 pixels (1647m) wide. A swath-to-swath overlap of 10 percent is standard during data collection, opening the door for potential applications involving multiple-view geometries. The amount of overlap is fully programmable, although maintaining some amount of overlap is recommended to ensure that there are no gaps in coverage. For spectral analysis, swaths are grouped into a single file by concatenating them. No resampling is performed at this stage, so spectral integrity of the data is not compromised. The Autonomous End-member Selector (AES) tool developed at EarthSat was used to determine the spectral end-members within the scene. This tool was written in the Interactive Data Language (IDL) and plugs into ENVITM image-processing software by Research Systems Inc. AES utilizes an orthogonal subspace transform tool to reduce the dimensionality of the data, thus shortening the required computing time. Several of the transformed bands are displayed in Figure 3. The transformed data is then examined to determine the dimensionality of the data, and therefore a first-order approximation of the number of spectral end-members capable of being extracted from the data. A convex hull is constructed for the data in N-dimensional space, where N is the number of end-members desired plus one. The additional end-member is used for the dark end-member, the only point at which all end-members have the same spectral shape because they are in complete shadow. An N-dimensional simplex is inflated within the convex hull to locate the most spectrally separable pixels. These pixels will lie at the vertices of the maximum volume simplex possible within the hull. The far SWIR portion of the spectrum (2050nm to 2450nm) was used to generate the end-members for this sub-scene, as this is the portion of the spectrum where many minerals have distinctive absorption features. An exception to this circumstance is the iron oxide mineral group, whose distinctive features often reside in the VNIR wavelengths. Four of the generated end-members are shown in Figure 4, with the USGS spectral library spectrum for the mineral present presented for comparison. The spectra in this figure are vertically offset to aid in comparison. The closely sampled spectral bands permit discrimination of narrow absorption features, such as the kaolinite doublet. The similarity of the image spectra with the library spectra indicates that HST is capable of producing mineral maps of high quality. Work is ongoing to generate a more complete spectral library encompassing the entire collected area, at which point linear spectral unmixing will be used to produce final mineral maps. Figure 5 is a preliminary mineral map showing the occurrence of alunite, calcite and kaolinite. Once the value-added results have been produced, such as via mineral maps, they are georectified for seamless integration within a GIS-based project. As mentioned in the previous section, IGM and GLT files are provided with the data as a means to georectify the data subsequent to any spectral processing. Figure 6 illustrates the process that takes us from a geometrically uncorrected image to a geometrically corrected, mosaicked product. Note that this process may be applied to image data, classified results or any other type of product, so long as the input retains the original raster dimensions. Summary The initial data emerging from the HyperSpecTIR sensor show its potential as a high-quality source of data for a broad range of applications. The use of beam-steering optics technology allows the collection of hyperspectral data with very high spatial resolution, without the need for specialized mounting and without compromising the signal-to-noise ratio. The data collected over Cuprite, Nev., as presented in this article, demonstrate HST’s ability to make highly detailed spectral measurements in the low signal, SWIR portion of the spectrum. Ongoing studies are expected to demonstrate the same ability to make detailed, accurate spectral measurements in the VNIR portion of spectrum, one heavily used for aquatic, vegetation and environmental applications. As these studies are completed in the upcoming months, the unique utility and flexibility of HST will make itself apparent.u About the Author: |
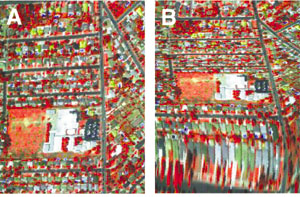 Figure
1. HST uses a beam-steering optics system that removes aircraft roll,
pitch, and yaw deviations in real time. Images shown are (a) with stabilization
on, and (b) with stabilization off.
Figure
1. HST uses a beam-steering optics system that removes aircraft roll,
pitch, and yaw deviations in real time. Images shown are (a) with stabilization
on, and (b) with stabilization off.