| TECHNOTES: PliableGIS for ArcView-Product Review
By Stacy Gorkoff Requirements: ESRI ArcView 8.1, Microsoft Windows NT Service Pack 6a or Windows 2000, 450MHz processor (minimum) 650MHz (preferred), 128MB RAM (minimum). Company: IDELIX Software Inc., 1122 Mainland St., Suite 400, Vancouver, BC, Canada V6B 5L1.
Price: US$250.00 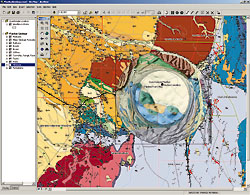 Introducing PliableGIS for ArcView 8.1 Introducing PliableGIS for ArcView 8.1
Across all industries, using existing GIS viewing functions evokes the frustrating question of "Where am I, and how does this area I am examining relate to the rest of my surroundings?" It is quite common to see productivity and workflow efficiency decrease as GIS users waste valuable time "zooming in" to view details of interest and "zooming out" to regain a previous or "big picture" view, or pan to view new regions.
PliableGIS for ArcView 8.1 is a powerful data exploration and presentation tool recently introduced by IDELIX Software Inc., designed to increase productivity and workflow efficiency. Targeted to ArcView 8.1 users who currently rely on existing zoom-, pan- and inset-viewing functions, this extension produces a virtual lens within a data set that allows users to see detail without losing a view of the "big picture." By employing this unique lens technology, ArcView 8.1 users can efficiently navigate and analyze regions of interest while maintaining a view of the data set in its entirety. Unlike existing zoom-, pan- and inset-window functionalities, no information is hidden or moved off the display.
A Look at the "Screen Real Estate Problem"
PliableGIS for ArcView is a solution to a key question emerging in GIS user-interface design of how best to use limited available display space. The "Screen Real Estate Problem" is a fundamental one that is faced by nearly every computer user of GIS and remote sensing software. Simply stated, it is the problem of having too much information (the 'information space') to fit in the available screen space (the 'display space').
Some examples of where this problem may be encountered includes the following:
• Local, Municipal or State Government - If a local, municipal, or state government planner needs to view an entire city or census map, it cannot fit on a computer monitor without first compressing the image to the point where much of the detail is no longer visible. Viewing such details as parcels and land-use coverage and census tracts can be done with existing zoom technology, but at the expense of losing a citywide or countywide perspective. The result is a hindered workflow and the inability to efficiently view the detail of these data sets within the context of the municipality or the county.
• Public Utilities - Within the public utilities sector, GIS analysts perform tasks that include monitoring facility and asset management, infrastructure planning, outage response and customer service calls. They face inefficiencies in their workflow that is caused by the inability to view the "big picture" while, at the same time, needing to see details of the problem region. Such details quickly become lost at the overall infrastructure level. By using existing zoom tools, it is difficult for these analysts to determine how the problem region relates to the rest of the distribution network.
• Defense - In the defense and intelligence communities, analysts conducting imagery analysis face the challenge of seeing detail without losing the context on a daily basis. A large satellite image, at full resolution, cannot fit onto a computer monitor without compressing the detail in the image. As an image or geospatial analyst zooms in to view various details, these users lose their navigational cues and become disoriented within the picture.
• Oil & Gas - GIS technologists working in the oil and gas industry also struggle with the ability to efficiently and accurately relate a potential drill site to the rest of its environmental and geological surroundings. With existing zoom functions, it is impossible to take what can be learned from the surroundings and make any direct correlations to the details of the drill site. It is also challenging to explore the detailed satellite imagery, digital aerial photo mosaics, seismic surveys, surface geology studies, subsurface and cross section interpretations, well locations and existing infrastructure information, while maintaining an understanding of the relation of the overall information to the details surrounding that site. A Look at PliableGIS Features and Functionality
PliableGIS for ArcView extends ArcView 8.1's existing functionality by addressing the fundamental problems associated with existing information presentation technologies, such as zoom, pan, scroll, insets, and separate views. PliableGIS for ArcView 8.1 provides true "detail-in-context" viewing tools, enabling the user to see and analyze regions of interest in detail while maintaining a view of the data surroundings and the important navigational cues provided within.
The PliableGIS lens appearing on the data set resembles a "virtual lens." The lens is pliable, and the center region of interest - or focal region - within the lens is magnified, but remains seamlessly connected to the rest of its surroundings. This lens can be fixed in place, or else moved in real time to explore the region of interest within a data set. The shape, size, magnification level and shoulder slopes of the lens are completely configurable by the end-user to suit viewing and data exploration needs.
Key functionalities of PliableGIS for ArcView include:
• A variety of lenses to suit data viewing needs
• Easy-to-use click-and-drag interface, with lens sizing and magnification controls
• Real-time manipulation of the lens position, shape and magnification
• Enhanced zoom, pan, and inspection capability
• Configurable lens: base region, focal region, and lens slope
• Viewing and rendering support for multi-layer vector, raster and mixed map data within both the ArcMap 'Data View' and 'Layout View'
• Advanced capabilities to adjust the entire viewing area to match the chosen level of magnification within the lens focal region
• Ability to resize the lens focal region to fit the entire viewing area
• Full support of ESRI Visible Scale Ranges and the drawing of layers based upon the level of magnification. Summary of PliableGIS Strengths
• Allows speedy navigation and analysis of information, where users can see details in a region of interest without sacrificing the view of the "big picture"
• Increases productivity by replacing zoom-and-pan searching with an intuitive set of virtual lenses that enable end-users to magnify detail within a region of interest without losing a view of the surrounding map context
• Enables better decision-making and a better understanding of data through enhanced magnification functions
• Improves presentation and communication of valuable information by clearly pinpointing and magnifying regions of interest
• Facilitates powerful data exploration by solving the "Screen Real Estate Problem" without loss of detail or resolution; the "Screen Real Estate Problem" is encountered when there is too much information to fit in the available screen space
• Enables efficient viewing of multiple map layers by supporting the rendering of ESRI Visible Scale Ranges, otherwise known as scale-dependent rendering.
PliableGIS gives end-users the power to view multiple layers and increase the scale rendering shown within the lens, while maintaining a view of the surroundings at the pre-determined level of magnification within both the ArcMap 'Data View' and 'Layout View.' PliableGIS Enhancements
Added functionality being considered for future releases include the following:
• Ability to use PliableGIS for ArcView in 3X applications
• Reporting geographic coordinates for the focal region of the lens
• Providing a rendering scale readout that indicates the level of magnification being used
• Support of multiple lenses
• Support of ESRI Measurement, Selection and Editing tools. Back |

